
 Yahoo Finance
 AUD/USD Forex Technical Analysis – Bearish Under .7575, Bullish Over .7588
The AUD/USD was under pressure for a fourth session on Thursday as investors continued to react to the divergence between the hawkish U.S. Federal Reserve and the Dovish Reserve Bank of Australia. The U.S. Dollar was also helped by strong economic data and an improving outlook for U.S. tax reform.

Daily Swing Chart Analysis
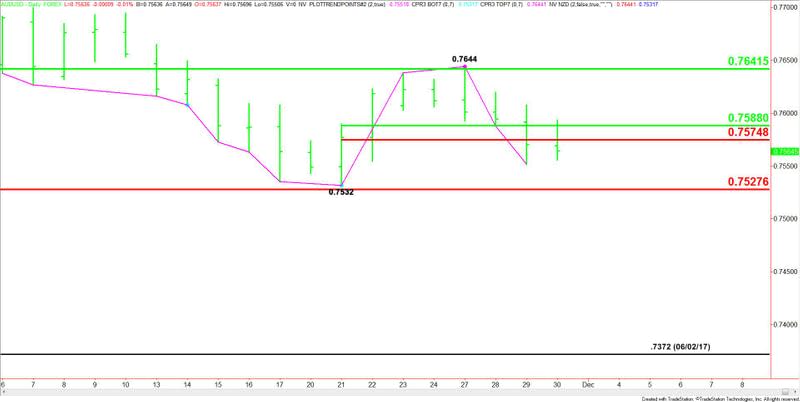
The main trend is down according to the daily swing chart. A trade through .7644 will change the main trend to up. A move through .7532 will signal a resumption of the downtrend.
The AUD/USD is currently trading inside a major retracement zone, bounded by .7642 and .7527. This zone is controlling the longer-term direction of the Forex pair.
The short-term range is .7532 to .7644. The AUD/USD is currently straddling its retracement zone at .7588 to .7575.
Daily Swing Chart Forecast
Based on Thursday’s close at .7564 and the earlier price action, the direction of the AUD/USD on Friday is likely to be determined by trader reaction to the short-term Fibonacci level at .7575.
A sustained move under .7575 will indicate the presence of sellers. This could create the downside momentum needed to challenge the main bottom at .7532 and the major Fibonacci level at .7527.
Taking out .7527 with conviction could trigger the start of an acceleration to the downside with the next major target the June 2 bottom at .7372.
A sustained move over .7575 will signal the presence of buyers. However, overtaking the 50% level at .7588 could fuel the start of an acceleration into .7642 and .7644.
Basically, look for a bearish tone on a sustained move under .7575 and a bullish tone on a sustained move over .7588.
This article was originally posted on FX Empire
