
 Yahoo Finance
 AUD/USD Forex Technical Analysis – Watch .7224 to .7230 into Close; Trend May Change to Up
Increased demand for higher risk assets is helping to boost the Australian Dollar on Tuesday. Although the trade dispute between the United States and China technically escalated earlier today, the reaction in the financial markets strongly suggests the latest tariffs on U.S. and Chinese goods are not as bad as previously feared.
At 1733 GMT, the AUD/USD is trading .7219, up 0.0047 or +0.66%.
Daily Swing Chart Technical Analysis
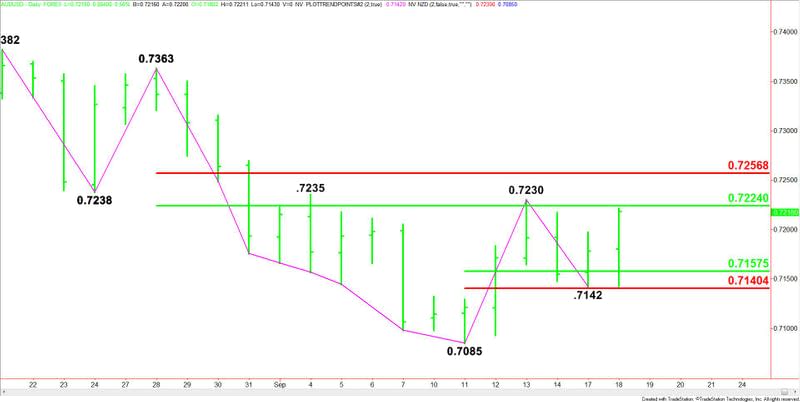
The main trend is down according to the daily swing chart, but the formation of a secondary higher bottom strongly suggests the trend is getting ready to turn up on the daily swing chart. A trade through .7230 will change the main trend to up. If this occurs then .7142 will become the new swing bottom.
With the main top at .7230 still intact, a trade through .7142 at this time will indicate the return of sellers, while a move through .7085 will signal a resumption of the downtrend.
The short-term range is .7085 to .7230. Its retracement zone at .7157 to .7140 is new support. This zone stopped the selling on Monday at .7142.
The main range is .7363 to .7085. Its retracement zone at .7224 to .7257 is new resistance. This zone stopped the rally on September 13 at .7230. This zone is also controlling the near-term direction of the market.
Daily Swing Chart Technical Forecast
Based on the early price action and the current price at .7219, the direction of the AUD/USD into the close is likely to be determined by trader reaction to the 50% level at .7224.
A sustained move under .7224 will indicate that sellers are stopping the rally in an effort to prevent a change in trend to up.
Taking out and sustaining a rally over .7224 will signal the presence of aggressive counter-trend buyers. If this creates enough upside momentum then the main top at .7230 should be taken out rather easily. This will change the trend to up and could trigger an extension of the rally into the Fibonacci level at .7257. This is another trigger point for a potential acceleration to the upside.
This article was originally posted on FX Empire
More From FXEMPIRE:
Broker NordFX Turns MetaTrader 5 into Unique Crypto Exchange
Price of Gold Fundamental Daily Forecast – Traders Showing Little Reaction to Fresh Tariffs
Dollar Falls as Demand for Risk Rises as New Tariffs Not as Bad as Previously Feared
E-mini Dow Jones Industrial Average (YM) Futures Analysis – September 18, 2018 Forecast
