AUD/USD Forex Technical Analysis – Intraday Reaction to .7157 Sets the Tone
The Australian Dollar rose to a 15-month high early Wednesday, underpinned by a weaker U.S. Dollar, but capped by data that showed Australia’s consumer prices fell by a record in the second quarter. Traders are also waiting to hear from the Federal Reserve later in the session as the inability to contain the spread of coronavirus threatens to derail the country’s economic recovery.
At 10:36 GMT, the AUD/USD is trading .7179, up 0.0022 or +0.30%.
Australia’s consumer price index (CPI) dived 1.9% in the second quarter, from the first, causing annual prices to drop 0.3% in the first negative reading since 1998. Forecasts were for a fall of 2.0% and 0.4%, respectively. That news delivered a blow to the Reserve Bank of Australia (RBA), which had only just managed to get inflation back up into its 2-3% target band after years of sub-par readings.
The Fed is not expected to announce any major policy decisions on Wednesday. Officials may point to a pending shift this fall in how it views its inflation target, or begin setting explicit goals for the jobless rate or inflation to be met before it considers raising interest rates from the current near-zero level.

Daily Swing Chart Technical Analysis
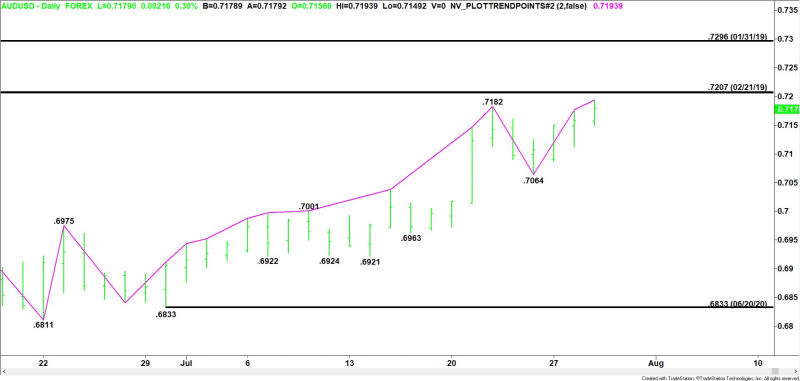
The main trend is up according to the daily swing chart. The uptrend was reaffirmed earlier today when buyers took out the previous main top at .7182. A trade through .7064 will change the main trend to down.
Daily Swing Chart Technical Forecast
The uptrend will continue today when buyers take out the intraday high at .7194. This could trigger a surge into the February 21, 2019 main top at .7207. We could see a technical bounce on the first test of this level.
However, overcoming .7207 could trigger an acceleration to the upside. The daily chart indicates there is plenty of room to the upside with the January 31, 2019 main top at .7296 the next major upside target.
A close below .7157 will form a potentially bearish closing price reversal top. This won’t change the trend, but it could trigger the start of a 2 to 3 day correction.
This article was originally posted on FX Empire

 Yahoo Finance