
 Yahoo Finance
 AUD/USD Forex Technical Analysis – Trading on Strong Side of .7379 Fib Level with .7427 Next Upside Target
The Australian Dollar is testing its highest level since August 11 on Thursday as a jump in vaccinations and this week’s encouraging economic data gave investors hope tough COVID-19 restrictions would be eased in coming weeks.
At 09:30 GMT, the AUD/USD is trading .7386, up 0.0019 or +0.25%.
Data on Wednesday showed the Australian economy had avoided a technical recession in the second quarter, spurring gains in the local currency, while a record trade surplus for July added to the improving outlook for the economy.
The Aussie is also being supported by a slight easing of U.S. Treasury yields as investors awaited new jobless claims figures, due to be released at 12:30 GMT. The report is expected to show 342K new filings during the week-ending August 28.
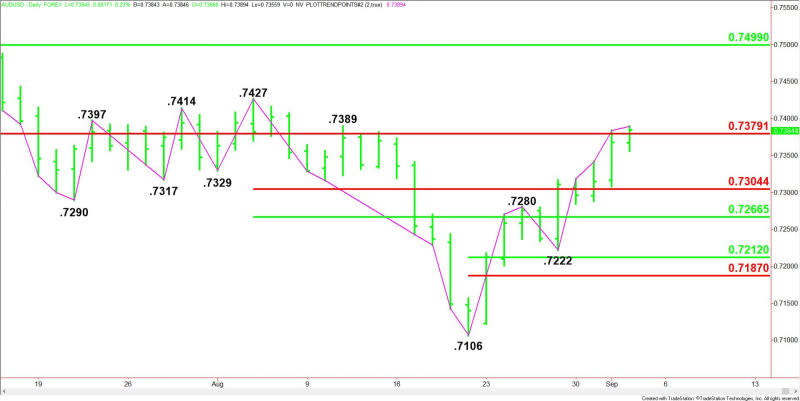
Daily Swing Chart Technical Analysis
The main trend is up according to the daily swing chart. A trade through the intraday high at .7389 will reaffirm the uptrend. A move through .7222 will change the main trend to down.
The minor trend is also up. Taking out the minor top at .7389 will indicate the buying is getting stronger.
The AUD/USD is currently trading inside a long-term retracement zone at .7379 to .7499. This zone is controlling the longer-term direction of the Forex pair.
The short-term range is .7427 to .7106. Its retracement zone at .7304 to .7266 is the nearest support.
Daily Swing Chart Technical Forecast
The direction of the AUD/USD on Thursday is likely to be determined by trader reaction to the long-term Fibonacci level at .7379.
Bullish Scenario
A sustained move over .7379 will indicate the presence of buyers. Taking out the minor top at .7389 will indicate the buying is getting stronger. This could trigger an acceleration to the upside with the next target the main top at .7427. Taking out this level will reaffirm the uptrend with .7499 next on the radar.
Bearish Scenario
A sustained move under .7379 will signal the presence of sellers. If this move creates enough downside momentum then look for a near-term break into the short-term Fibonacci level at .7304.
For a look at all of today’s economic events, check out our economic calendar.
This article was originally posted on FX Empire
