
 Yahoo Finance
 AUD/USD Forex Technical Analysis – Breakout Over .6920 Targets .6941 – .6962 Retracement Zone
The Australian Dollar is inching lower early Thursday after giving up earlier gains. The early rally was likely fueled by the hope that the signing of Phase One of the U.S.-China trade deal on Wednesday would eventually lead to a stronger economy.
However, reality set in as traders started to sell the Aussie on increasing bets for a Reserve Bank of Australia rate cut due to the bushfire crisis that is expected to have a notable short-term impact on the economy.
At 07:41 GMT, the AUD/USD is trading .6904, down 0.0002 or -0.03%. This is down from an intraday high of .6919.
Daily Swing Chart Technical Analysis
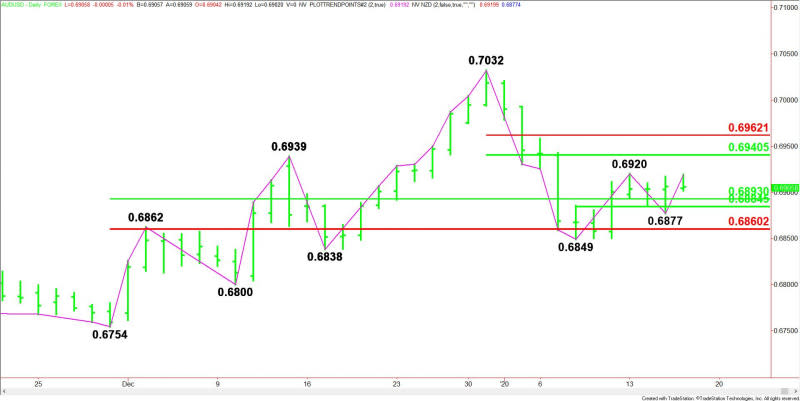
The main trend is up according to the daily swing chart. However, momentum has been trending lower since December 31. A trade through .6920 will shift momentum to the upside.
The first sign of weakness will be a trade through .6877. This technically changes the main trend to down, but taking out the main bottoms at .6849 and .6838 wound be more significant moves.
The main range is .6754 to .7032. Its retracement zone at .6893 to .6860 is support. Since posting the main bottom at .6849 on January 8, traders have been trying to form a support base. The secondary higher bottom at .6877 is also a sign that buyers are coming in to support the Aussie. Taking out .6920 will confirm this new higher bottom.
The minor range is .6849 to .6920. Its 50% level at .6884 falls inside the main range. It’s also potential support.
The short-term range is .7032 to .6849. Its retracement zone at .6941 to .6962 is the next likely upside target.
Daily Swing Chart Technical Forecast
Based on the early price action and the current price at .6904, the direction of the AUD/USD the rest of the session on Thursday is likely to be determined by trader reaction to .6920.
Bullish Scenario
A sustained move over .6920 will indicate the buying is getting stronger. This could trigger a rally into the .6941 to .6962 retracement zone. This won’t be a bullish move, per se. It may just be a move designed to create another shorting opportunity for bearish traders. They are going to try to set up a secondary lower top.
Bearish Scenario
A sustained move under .6920 will signal the presence of sellers. The first downside targets are a pair of 50% levels at .6893 and .6884, followed by a main bottom at .6877.
Taking out .6877 will indicate the selling is getting stronger. This could trigger a further break into .6860, .6849 and .6838. The latter is a potential trigger point for an acceleration to the downside.
This article was originally posted on FX Empire
