
 Yahoo Finance
 AUD/USD Forex Technical Analysis – Main Trend Up, Minor Trend Changed to Down, Shifting Momentum
The Australian Dollar is under pressure early Tuesday after disappointing economic data further dimmed the chance of an interest rate hike. Earlier in the session, Australia reported positive but lower-than-expected third-quarter economic growth of 0.3 percent. The previous month was revised lower to just 2.8 percent. On Tuesday, the Aussie reversed early strength as demand for higher risk assets plunged on fears of a global economic slowdown.
At 0624 GMT, the AUD/USD was trading .7288, down 0.0049 or -0.68%.
Daily Swing Chart Technical Analysis
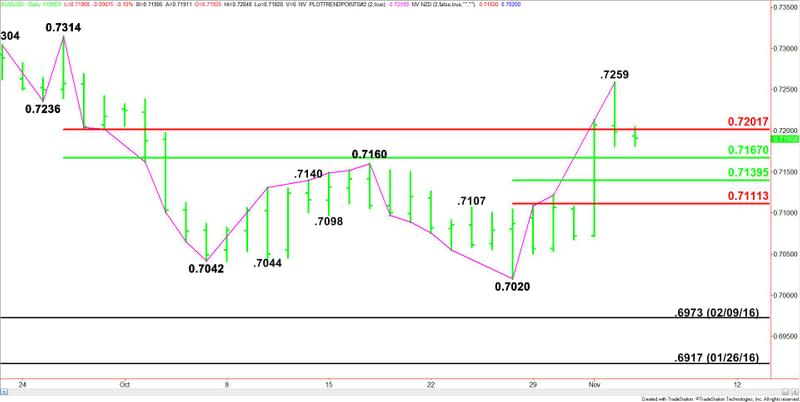
The main trend is up according to the daily swing chart, however, momentum is trending lower. A new main top has formed at .7394. A trade through this level will signal a resumption of the uptrend. The main trend will change to down on a trade through .7199.
The minor trend is down. It turned down earlier today when sellers took out the previous minor bottom at .7284. The move shifted momentum to the downside.
The Aussie is currently trading inside a major retracement zone at .7252 to .7307. Inside this zone is a short-term retracement area at .7297 to .7273. This area could develop into support.
If .7252 fails as support then the selling could extend into the next retracement zone at .7207 to .7163. Inside this zone is a pair of bottoms at .7199 and .7164.
Daily Swing Chart Technical Forecast
Based on the current price at .7288 and the earlier price action, the direction of the AUD/USD the rest of the session is likely to be determined by trader reaction to the short-term 50% level at .7297.
Bullish Scenario
A sustained move over .7297 will indicate the presence of buyers. The next target is .7307. Overcoming this level will indicate the buying is getting stronger.
Bearish Scenario
A sustained move under .7297 will signal the presence of sellers. This could lead to a quick test of .7273. If this price level fails then look for further selling into .7252.
The daily chart begins to open up to the downside under .7252. This could trigger an acceleration to the downside with .7207 the next major target, followed closely by the main bottom at .7199.
This article was originally posted on FX Empire
