
 Yahoo Finance
 AUD/USD Forex Technical Analysis – Holding Retracement Zone Support at .6893 – .6884
The Australian Dollar is edging lower on Wednesday as investors continue to bet on a rate cut by the Reserve Bank of Australia (RBA) as bushfires hit the economy. On top of a damage bill likely to run to billions, analysts expect that consumer sentiment, retail spending and tourism, which account for more than 3% of the economy, will all take a hit.
At 06:15 GMT, the AUD/USD is trading .6897, down 0.0006 or -0.09%.
Daily Swing Chart Technical Analysis
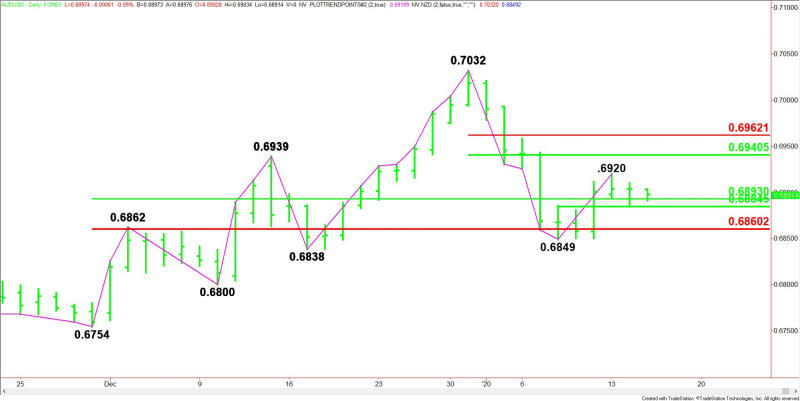
The main trend is up according to the daily swing chart. However, momentum has been trending lower since December 31. A trade through .6849 will change the main trend to down. This move will also make .6920 a secondary lower top, which will not be a good sign for the bulls.
Taking out the new minor top at .6920 will shift momentum back to the upside.
The main range is .6754 to .7032. Its retracement zone at .6893 to .6860 is still hanging in there as support.
The short-term range is .7032 to .6849. Its retracement zone at .6941 to .6962 is a potential upside target. If tested, look for aggressive counter-trend to try to stop the rally and form a secondary lower top.
The minor range is .6849 to .6920. Its 50% level at .6884 is minor support. It falls inside the main retracement zone so traders are paying attention to it.
Daily Swing Chart Technical Forecast
Based on the early price action and the current price at .6897, the direction of the AUD/USD the rest of the session on Wednesday is likely to be determined by trader reaction to the main 50% level at .6893.
Bullish Scenario
A sustained move over .6893 will indicate the presence of buyers. The first upside target is the minor top at .6920. Taking out this level is likely to trigger a surge into the short-term retracement zone at .6941 to .6962.
Bearish Scenario
A sustained move under .6893 will signal the presence of sellers. The first target is .6884. If this level fails then look for the selling to possibly extend into .6860, followed closely by .6849.
This article was originally posted on FX Empire
