
 Yahoo Finance
 AUD/USD Forex Technical Analysis – Trade Through .7758 Will Reaffirm the Downtrend
The Australian Dollar tumbled on Wednesday, after minutes of the Federal Reserve’s January meeting showed policymakers were more confident of the need to keep raising interest rates.
The AUD/USD settled at .7802, down 0.0081 or -1.03%. The selling resumed early Thursday, sending the Forex pair to .7789 before it reversed to the upside and turned positive for the session. At 0609 GMT, it is trading .7811, up 0.0009 or +0.11%.
Daily Technical Swing Chart Analysis
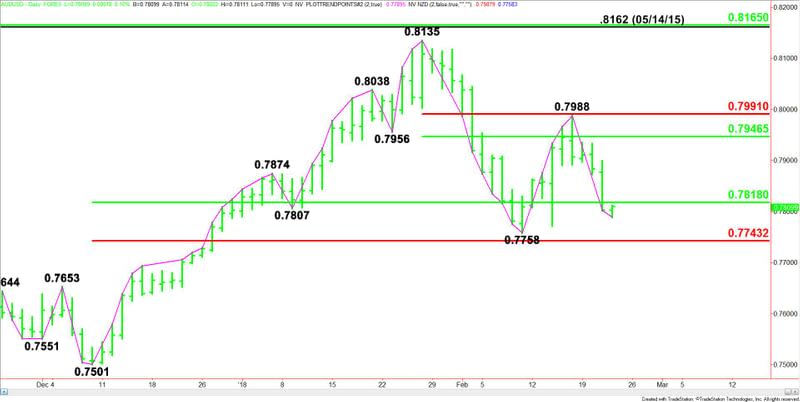
The main trend is down according to the daily swing chart. A trade through .7758 will signal a resumption of the downtrend. The main trend will change to up on a move through .7988.
The short-term range is .8135 to .7758. Its retracement zone at .7947 to .7991 is resistance. This zone stopped the rally at .7988 on February 16.
The main range is .7501 to .8135. Its retracement zone at .7818 to .7743 is the primary downside target. This zone is support. It stopped the selling on February 9 at .7758. It is currently being tested.
Daily Technical Swing Chart Forecast
Based on the early trade, the direction of the AUD/USD today is likely to be determined by trader reaction to the 50% level at .7818.
A sustained move under .7818 will signal the presence of sellers. If the downside momentum resumes, we could see a move into the .7758 main bottom. This is followed closely by the main Fibonacci level at .7743.
The Fib level is the trigger point for an acceleration to the downside. The daily chart indicates there is plenty of room to the downside with the next target the December 8 main bottom at .7501.
Overcoming and sustaining a move over .7818 will indicate the presence of buyers. If this move creates enough upside momentum then we could see a possible move into .7947, .7988 or .7991 over the near-term. The chances of the AUD/USD returning to these levels is pretty remote. It would have to take a major drop in U.S. interest rates to drive the Forex pair into these targets.
This article was originally posted on FX Empire
