
 Yahoo Finance
 AUD/USD Forex Technical Analysis – Bullish Over .7886, Bearish Under .7812
Appetite for risk helped drive the AUD/USD higher last week. However, this week, rising U.S. Treasury yields may start to put some pressure on the Forex pair due to the tightening of the spread between U.S. Government Bonds and Australian Government bonds. Essentially, gains may be limited because of the divergence between the hawkish U.S. Federal Reserve monetary policy and the neutral Reserve Bank of Australia monetary policy.
The AUD/USD settled last week at .7862, up 0.0060 or +0.76%.
Weekly Technical Analysis
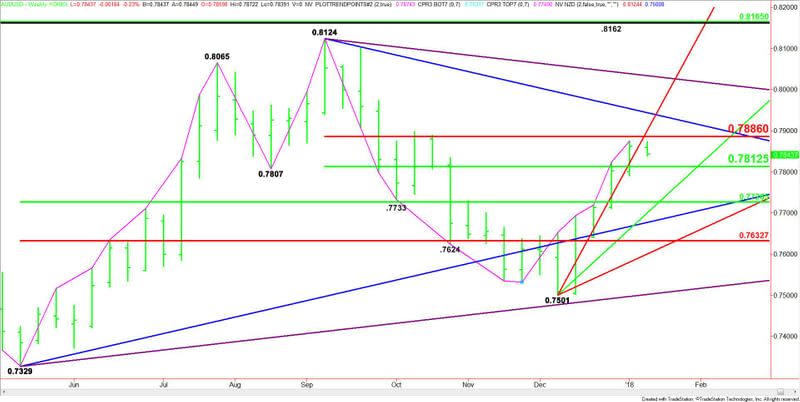
The main trend is down according to the weekly swing chart. Although the AUD/USD has been rallying since hitting a bottom at .7501 the week-ending December 8, momentum won’t shift to the upside until the Forex pair overtakes a key retracement zone. All we’ve seen so far is aggressive short-covering.
The main range is .8124 to .7501. Its retracement zone at .78125 to .7886 is currently being tested. Trader reaction to this zone will determine the near-term direction of the market.
The major range is .7329 to .8124. The AUD/USD is trading on the strong side of this retracement zone, helping to give it an upside bias. Its retracement zone at .77265 to .7633 is support.
Weekly Technical Forecast
Based on last week’s close at .7862 and last week’s price action, the direction of the AUD/USD this week will be determined by trader reaction to the Fibonacci level at .7886.
A sustained move under .7886 will signal the presence of sellers. This could lead to a test of the 50% level at .78125. This level is the trigger point for an acceleration to the downside with the next major targets coming in at .77265 and .7701.
Overtaking and sustaining a rally over .7886 will indicate the presence of buyers. Overtaking the steep uptrending Gann angle at .7901 will indicate the buying is getting stronger. This could lead to a test of the downtrending Gann angle at .7944.
The angle at .7944 is the trigger point for an acceleration into the next downtrending Gann angle at .8034. This is the last potential resistance angle before the .8124 main top.
Basically, look for the upside bias to continue on a sustained move over .7886 and a downside bias to develop on a sustained move under .78125.
This article was originally posted on FX Empire
