
 Yahoo Finance
 AUD/USD Forex Technical Analysis – Testing Major Retracement Zone; Ripe for Closing Price Reversal Top
The Australian Dollar is trading higher early Tuesday, but backing off its high as traders probe a key retracement area that should determine whether the rally continues or begins to fizzle out on profit-taking.
Furthermore, if optimism over a partial trade deal between the U.S. and China being signed as early as next month was behind the rally, then a dampening of that hope could help reverse prices to the downside.
At 03:12 GMT, the AUD/USD is trading .7871, up 0.0004 or +0.06%.
The Aussie has been boosted since last Friday after President Donald Trump said he would like to sign phase one of the newly proposed partial trade deal when he meets his Chinese counterpart at November’s APEC summit. However, on Monday, the U.S. commerce secretary said an initial trade deal does not need to be finalized next month. This may create enough doubt to encourage profit-taking.
Daily Swing Chart Technical Analysis
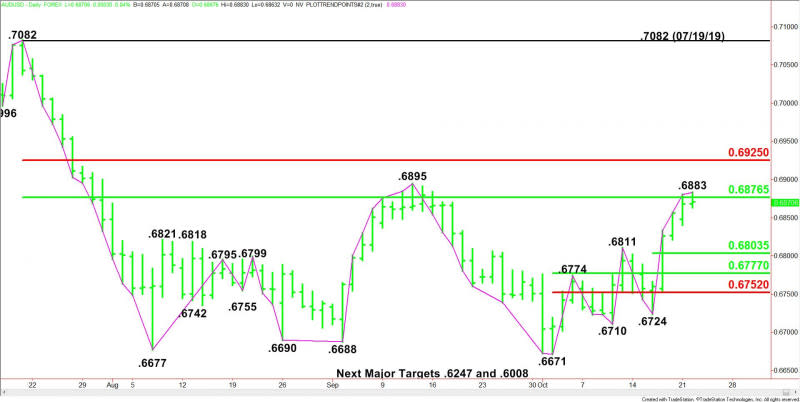
The main trend is up according to the daily swing chart. A trade through the September 12 main top at .6895 will reaffirm the uptrend.
The main trend will change to down on a trade through .6724. This is highly unlikely, however, nonetheless, the prolonged rally in terms of price and time since the .6671 main bottom on October 1, has put the AUD/USD inside the window of time for a potentially bearish closing price reversal top.
The main range is .7082 to .6671. Its retracement zone at .6877 to .6925 is currently being tested. This zone is also potential resistance. It’s also controlling the longer-term direction of the AUD/USD.
The minor range is .6724 to .6883. Its 50% level or pivot at .6803 is the first potential downside target.
The short-term range is .6671 to .6883. If the first support fails then look for the selling to possibly extend into the next support zone at .6777 to .6752.
Daily Swing Chart Technical Forecast
Based on the early price action and the current price at .7871, the direction of the AUD/USD on Tuesday is likely to be determined by trader reaction to the major 50% level at .6877.
Bullish Scenario
A sustained move over .6877 will indicate the presence of buyers. The first upside target is today’s intraday high at .6883, followed by the main top at .6895. This is a potential trigger point for a surge into the Fibonacci level at .6925.
Bearish Scenario
A sustained move under .6876 will signal the presence of sellers. If this creates enough downside momentum then the AUD/USD will turn lower for the session. This will put it in a position to form a closing price reversal top, while setting up the Forex pair for an eventual break into the minor 50% level at .6803.
Side Notes
A close under .6868 will form a closing price reversal top. If confirmed, this could trigger the start of a 2 to 3 day correction with .6803 the primary downside target.
This article was originally posted on FX Empire
More From FXEMPIRE:
Gold Price Prediction – Prices Slip as Yields Rise Buoying the Greenback
Bitcoin Cash – ABC, Litecoin and Ripple Daily Analysis – 22/10/19
Natural Gas Price Prediction – Prices Tumble as Hedge Funds Add to Short Positions
USD/JPY Fundamental Daily Forecast – Flat as Investors Begin to Price in Fed, BOJ Rate Cuts
Natural Gas Price Fundamental Daily Forecast – Warmer Shift in Weather Reduces Speculative Demand
