
 Yahoo Finance
 AUB Group Limited (ASX:AUB) Investors Are Paying Above The Intrinsic Value

Valuing AUB, an insurance stock, can be daunting since these financial firms generally have cash flows that are impacted by regulations that are not imposed upon other industries. For example, insurance firms don’t have gross profits as such, but gross written premiums play a huge part in forecasting cash flows. Examining data points such as book values, as well as the return and cost of equity, is suitable for calculating AUB’s value. Today we’ll take a look at how to value AUB in a fairly effective and uncomplicated method. See our latest analysis for AUB Group
What Model Should You Use?
Before we begin, remember that financial stocks differ in terms of regulation and balance sheet composition. The regulatory environment in Australia is fairly rigorous. In addition to this, insurance companies usually do not possess substantial amounts of tangible assets on their books. This means the Excess Returns model is best suited for calculating the intrinsic value of AUB rather than the traditional discounted cash flow model, which has more emphasis on things like capital expenditure and depreciation.
Deriving AUB’s Intrinsic Value
The main assumption for Excess Returns is that equity value is how much the firm can earn, over and above its cost of equity, given the level of equity it has in the company at the moment. The returns above the cost of equity is known as excess returns:
Excess Return Per Share = (Stable Return On Equity – Cost Of Equity) (Book Value Of Equity Per Share)
= (14.97% – 8.55%) * A$5.58 = A$0.36
Excess Return Per Share is used to calculate the terminal value of AUB, which is how much the business is expected to continue to generate over the upcoming years, in perpetuity. This is a common component of discounted cash flow models:
Terminal Value Per Share = Excess Return Per Share / (Cost of Equity – Expected Growth Rate)
= A$0.36 / (8.55% – 2.77%) = A$6.19
Putting this all together, we get the value of AUB’s share:
Value Per Share = Book Value of Equity Per Share + Terminal Value Per Share
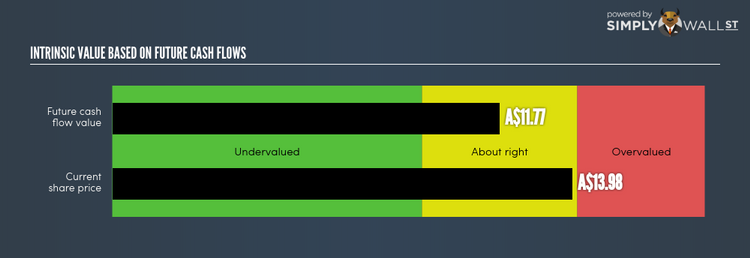
= A$5.58 + A$6.19 = A$11.77
Relative to today’s price of A$13.98, AUB is currently priced in-line with its intrinsic value. This means AUB isn’t an attractive buy right now. Valuation is only one side of the coin when you’re looking to invest, or sell, AUB. Analyzing fundamental factors are equally important when it comes to determining if AUB has a place in your holdings.
Next Steps:
For insurance companies, there are three key aspects you should look at:
Financial health: Does it have a healthy balance sheet? Take a look at our free bank analysis with six simple checks on things like leverage and risk.
Future earnings: What does the market think of AUB going forward? Our analyst growth expectation chart helps visualize AUB’s growth potential over the upcoming years.
Dividends: Most people buy financial stocks for their healthy and stable dividends. Check out whether AUB is a dividend Rockstar with our historical and future dividend analysis.
For more details and sources, take a look at our full calculation on AUB here.
To help readers see pass the short term volatility of the financial market, we aim to bring you a long-term focused research analysis purely driven by fundamental data. Note that our analysis does not factor in the latest price sensitive company announcements.
The author is an independent contributor and at the time of publication had no position in the stocks mentioned.
