
 Yahoo Finance
 Is AUB Group Limited (ASX:AUB) Expensive For A Reason? A Look At The Intrinsic Value

One of the most difficult industry to value is insurance, given that they adhere to different rules compared to other companies. For instance, insurance firms that invest excess premiums are required to maintain a certain level of reserves to reduce the risk to shareholders. Examining factors such as book values, as well as the return and cost of equity, is beneficial for determining AUB’s true value. Below I’ll determine how to value AUB in a fairly accurate and simple approach.
See our latest analysis for AUB Group
Why Excess Return Model?
Two main things that set financial stocks apart from the rest are regulation and asset composition. The regulatory environment in Australia is fairly rigorous. Furthermore, insurance companies tend to not have significant amounts of tangible assets on their books. This means the Excess Returns model is best suited for calculating the intrinsic value of AUB rather than the traditional discounted cash flow model, which has more emphasis on things like capital expenditure and depreciation.
Deriving AUB’s Intrinsic Value
The main assumption for Excess Returns is, the value of the company is how much money it can generate from its current level of equity capital, in excess of the cost of that capital. The returns above the cost of equity is known as excess returns:
Excess Return Per Share = (Stable Return On Equity – Cost Of Equity) (Book Value Of Equity Per Share)
= (0.16% – 8.6%) x A$5.38 = A$0.38
Excess Return Per Share is used to calculate the terminal value of AUB, which is how much the business is expected to continue to generate over the upcoming years, in perpetuity. This is a common component of discounted cash flow models:
Terminal Value Per Share = Excess Return Per Share / (Cost of Equity – Expected Growth Rate)
= A$0.38 / (8.6% – 2.8%) = A$6.62
Putting this all together, we get the value of AUB’s share:
Value Per Share = Book Value of Equity Per Share + Terminal Value Per Share
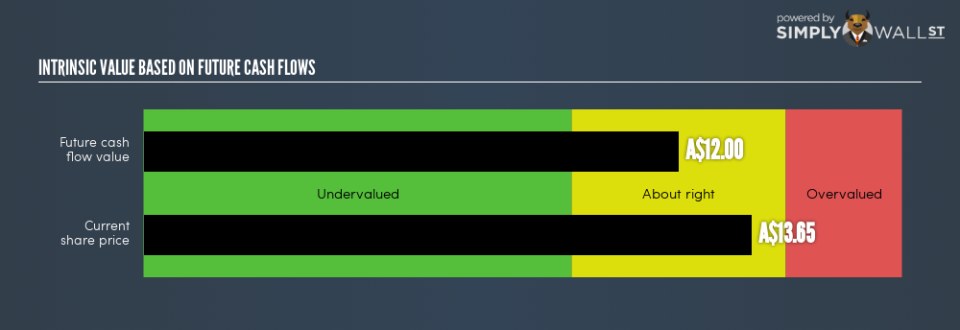
= A$5.38 + A$6.62 = A$12
This results in an intrinsic value of A$12. Given AUB’s current share price of AU$13.65, AUB is currently trading in-line with its true value. Therefore, there’s a bit of a downside if you were to buy AUB today. Valuation is only one part of your investment analysis for whether to buy or sell AUB. There are other important factors to keep in mind when assessing whether AUB is the right investment in your portfolio.
Next Steps:
For insurance companies, there are three key aspects you should look at:
Financial health: Does it have a healthy balance sheet? Take a look at our free bank analysis with six simple checks on things like leverage and risk.
Future earnings: What does the market think of AUB going forward? Our analyst growth expectation chart helps visualize AUB’s growth potential over the upcoming years.
Dividends: Most people buy financial stocks for their healthy and stable dividends. Check out whether AUB is a dividend Rockstar with our historical and future dividend analysis.
For more details and sources, take a look at our full calculation on AUB here.
To help readers see past the short term volatility of the financial market, we aim to bring you a long-term focused research analysis purely driven by fundamental data. Note that our analysis does not factor in the latest price-sensitive company announcements.
The author is an independent contributor and at the time of publication had no position in the stocks mentioned. For errors that warrant correction please contact the editor at editorial-team@simplywallst.com.
