
 Yahoo Finance
 Atrato Onsite Energy (LON:ROOF) Might Have The Makings Of A Multi-Bagger
If you're looking for a multi-bagger, there's a few things to keep an eye out for. Amongst other things, we'll want to see two things; firstly, a growing return on capital employed (ROCE) and secondly, an expansion in the company's amount of capital employed. Put simply, these types of businesses are compounding machines, meaning they are continually reinvesting their earnings at ever-higher rates of return. With that in mind, we've noticed some promising trends at Atrato Onsite Energy (LON:ROOF) so let's look a bit deeper.
Understanding Return On Capital Employed (ROCE)
For those that aren't sure what ROCE is, it measures the amount of pre-tax profits a company can generate from the capital employed in its business. The formula for this calculation on Atrato Onsite Energy is:
Return on Capital Employed = Earnings Before Interest and Tax (EBIT) ÷ (Total Assets - Current Liabilities)
0.047 = UK£6.4m ÷ (UK£139m - UK£648k) (Based on the trailing twelve months to September 2023).
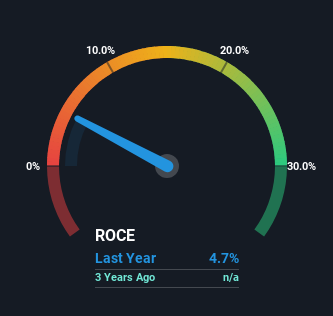
Thus, Atrato Onsite Energy has an ROCE of 4.7%. Ultimately, that's a low return and it under-performs the Electrical industry average of 9.8%.
View our latest analysis for Atrato Onsite Energy
While the past is not representative of the future, it can be helpful to know how a company has performed historically, which is why we have this chart above. If you'd like to look at how Atrato Onsite Energy has performed in the past in other metrics, you can view this free graph of Atrato Onsite Energy's past earnings, revenue and cash flow.
What Can We Tell From Atrato Onsite Energy's ROCE Trend?
Atrato Onsite Energy has broken into the black (profitability) and we're sure it's a sight for sore eyes. The company now earns 4.7% on its capital, because one year ago it was incurring losses. On top of that, what's interesting is that the amount of capital being employed has remained steady, so the business hasn't needed to put any additional money to work to generate these higher returns. That being said, while an increase in efficiency is no doubt appealing, it'd be helpful to know if the company does have any investment plans going forward. So if you're looking for high growth, you'll want to see a business's capital employed also increasing.
What We Can Learn From Atrato Onsite Energy's ROCE
As discussed above, Atrato Onsite Energy appears to be getting more proficient at generating returns since capital employed has remained flat but earnings (before interest and tax) are up. Astute investors may have an opportunity here because the stock has declined 12% in the last year. So researching this company further and determining whether or not these trends will continue seems justified.
Atrato Onsite Energy does have some risks, we noticed 2 warning signs (and 1 which is significant) we think you should know about.
For those who like to invest in solid companies, check out this free list of companies with solid balance sheets and high returns on equity.
Have feedback on this article? Concerned about the content? Get in touch with us directly. Alternatively, email editorial-team (at) simplywallst.com.
This article by Simply Wall St is general in nature. We provide commentary based on historical data and analyst forecasts only using an unbiased methodology and our articles are not intended to be financial advice. It does not constitute a recommendation to buy or sell any stock, and does not take account of your objectives, or your financial situation. We aim to bring you long-term focused analysis driven by fundamental data. Note that our analysis may not factor in the latest price-sensitive company announcements or qualitative material. Simply Wall St has no position in any stocks mentioned.
Have feedback on this article? Concerned about the content? Get in touch with us directly. Alternatively, email editorial-team@simplywallst.com
