
 Yahoo Finance
 ASX 200 Technical Analysis: Short Term Range Still Holding
DailyFX.com -
Talking Points:
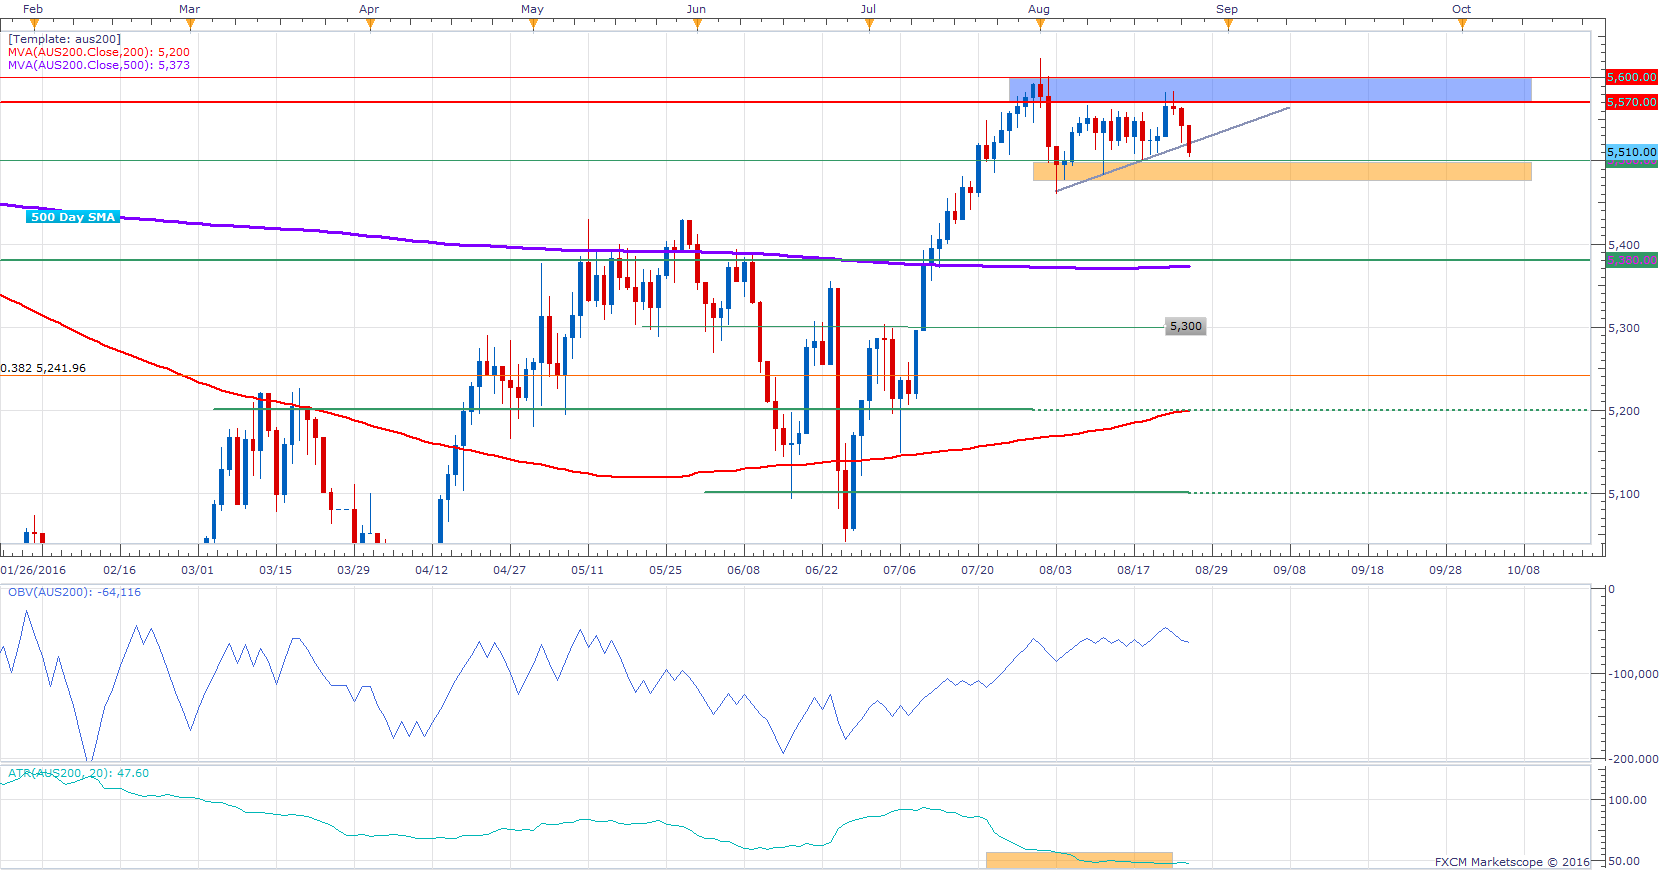
- Index trading at a resistance zone below 5,600 after a push higher
- Price has been trading sideways between 5,500 and 5,570 since the beginning of the month
- 20-day ATR readings still at lowest level since September 2014
Showcase your trading skills against your peers in FXCM's $10,000 Monthly Challenge Here, but learn good trading habits with the “Traits of successful traders” series
The ASX 200 is trading lower at the time of writing, after a resistance area between 5,570 and 5,600 contained price gains, with volatility printing its lowest levels since September 2014 (based on a 20-day ATR study).
The Index is still trading sideways, between the 5,500 support and the 5,600 resistance area, which means that a break to either side of this trading range could prove influential:
At this stage, a break below the 5,500 area might shift focus to possible support around the 5,380-5,400 area.
A clear move above 5,600 could indicate the long term uptrend may have resumed and signal further bullish intentions, possibly exposing the 5,700 level initially for potential resistance.
OBV is showing strength relative to price action.
ASX 200 Daily Chart: August 26 2016
--- Written by Oded Shimoni, Junior Currency Analyst for DailyFX.com
To contact Oded Shimoni, e-mail oshimoni@dailyfx.com
Follow him on Twitter at @OdedShimoni
DailyFX provides forex news and technical analysis on the trends that influence the global currency markets.
Learn forex trading with a free practice account and trading charts from FXCM.
