ASX 200 Technical Analysis: Broken Trendline, Heavy Cap
DailyFX.com -
Talking Points:
The ASX has looked stuck for weeks as the year’s peaks prove too high
However, it has at least not fallen far
Could this change with this week’s trendline break?
The Australian ASX 200 equity benchmark’s 2017 story is in many ways the story of developed-market stocks everywhere.
It entered the year quite triumphant after the long, steep climb which followed Donald Trump’s shock presidential election win. But then – well – it did nothing much of anything except hold on. The ASX hasn’t fallen far this year, but it hasn’t managed to build convincing gains either.
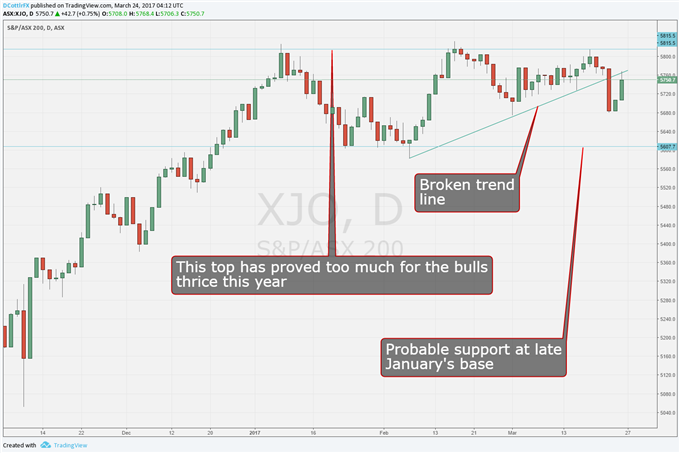
So far, so like most of its peers. But, unlike many of them, the ASX has tried to regain that top twice after its initial rejection on January 10, and failed on every occasion. It arguably made a third brave foray on March 2.
Bluntly, it looks as though the year’s peak around 5185.50 is becoming ever-more formidable resistance.
And there’s more bad news. As it fell this week, the ASX snapped a nice little rising trend line which had been in place for a comforting 32 straight sessions. It gave way on Wednesday. Now admittedly it has not yet done so conclusively. There must still be some hope that the index can fight its way back above it. Indeed, it will have accomplished that on Friday if it can close above 5765. That’s not a huge ask from current levels (5752.50 at 0400 GMT Friday)
But as things stand, the ASX is below a broken-if-minor trend line and way below a 2017 peak which has repeatedly proved too much for the bulls. These are both bad signs. Furthermore, clear daily-chart support is hard to spot at current levels. For that we have to get all the way back down to the 5605 level at which the index formed its last solid base, back in late January.
Under Pressure: ASX 200
Would you like to know more about financial market trading? The DailyFX trading guide is for you.
--- Written by David Cottle, DailyFX Research
Contact and follow David on Twitter:@DavidCottleFX
DailyFX provides forex news and technical analysis on the trends that influence the global currency markets.
Learn forex trading with a free practice account and trading charts from IG.

 Yahoo Finance

