
 Yahoo Finance
 Armada Hoffler Properties (NYSE:AHH) investors are sitting on a loss of 7.7% if they invested five years ago
Armada Hoffler Properties, Inc. (NYSE:AHH) shareholders should be happy to see the share price up 11% in the last month. But over the last half decade, the stock has not performed well. After all, the share price is down 30% in that time, significantly under-performing the market.
With that in mind, it's worth seeing if the company's underlying fundamentals have been the driver of long term performance, or if there are some discrepancies.
Check out our latest analysis for Armada Hoffler Properties
To paraphrase Benjamin Graham: Over the short term the market is a voting machine, but over the long term it's a weighing machine. By comparing earnings per share (EPS) and share price changes over time, we can get a feel for how investor attitudes to a company have morphed over time.
During the five years over which the share price declined, Armada Hoffler Properties' earnings per share (EPS) dropped by 8.1% each year. This change in EPS is reasonably close to the 7% average annual decrease in the share price. That suggests that the market sentiment around the company hasn't changed much over that time. Rather, the share price has approximately tracked EPS growth.
You can see how EPS has changed over time in the image below (click on the chart to see the exact values).
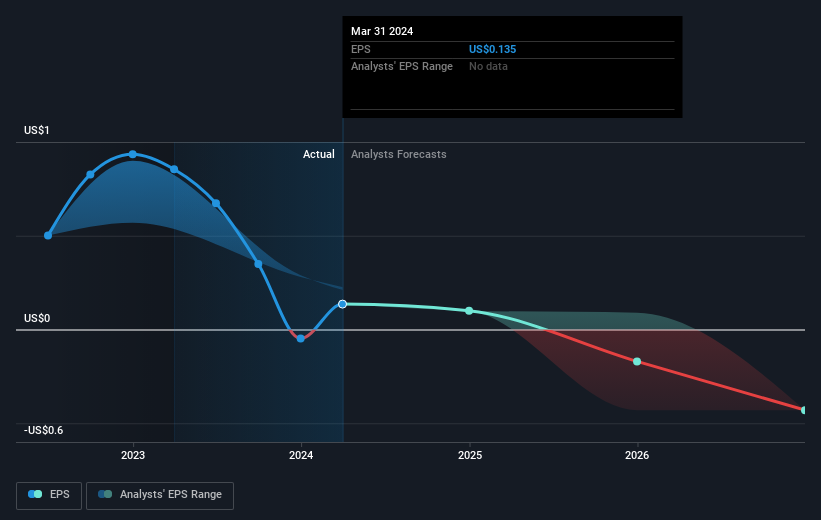
We consider it positive that insiders have made significant purchases in the last year. Having said that, most people consider earnings and revenue growth trends to be a more meaningful guide to the business. Dive deeper into the earnings by checking this interactive graph of Armada Hoffler Properties' earnings, revenue and cash flow.
What About Dividends?
As well as measuring the share price return, investors should also consider the total shareholder return (TSR). The TSR incorporates the value of any spin-offs or discounted capital raisings, along with any dividends, based on the assumption that the dividends are reinvested. Arguably, the TSR gives a more comprehensive picture of the return generated by a stock. In the case of Armada Hoffler Properties, it has a TSR of -7.7% for the last 5 years. That exceeds its share price return that we previously mentioned. And there's no prize for guessing that the dividend payments largely explain the divergence!
A Different Perspective
Armada Hoffler Properties shareholders gained a total return of 8.4% during the year. But that return falls short of the market. But at least that's still a gain! Over five years the TSR has been a reduction of 1.5% per year, over five years. It could well be that the business is stabilizing. It's always interesting to track share price performance over the longer term. But to understand Armada Hoffler Properties better, we need to consider many other factors. Consider for instance, the ever-present spectre of investment risk. We've identified 4 warning signs with Armada Hoffler Properties (at least 2 which make us uncomfortable) , and understanding them should be part of your investment process.
There are plenty of other companies that have insiders buying up shares. You probably do not want to miss this free list of growing companies that insiders are buying.
Please note, the market returns quoted in this article reflect the market weighted average returns of stocks that currently trade on American exchanges.
Have feedback on this article? Concerned about the content? Get in touch with us directly. Alternatively, email editorial-team (at) simplywallst.com.
This article by Simply Wall St is general in nature. We provide commentary based on historical data and analyst forecasts only using an unbiased methodology and our articles are not intended to be financial advice. It does not constitute a recommendation to buy or sell any stock, and does not take account of your objectives, or your financial situation. We aim to bring you long-term focused analysis driven by fundamental data. Note that our analysis may not factor in the latest price-sensitive company announcements or qualitative material. Simply Wall St has no position in any stocks mentioned.
