
 Yahoo Finance
 Appen Limited's (ASX:APX) Fundamentals Look Pretty Strong: Could The Market Be Wrong About The Stock?
It is hard to get excited after looking at Appen's (ASX:APX) recent performance, when its stock has declined 35% over the past three months. But if you pay close attention, you might find that its key financial indicators look quite decent, which could mean that the stock could potentially rise in the long-term given how markets usually reward more resilient long-term fundamentals. In this article, we decided to focus on Appen's ROE.
Return on Equity or ROE is a test of how effectively a company is growing its value and managing investors’ money. In short, ROE shows the profit each dollar generates with respect to its shareholder investments.
See our latest analysis for Appen
How Is ROE Calculated?
The formula for ROE is:
Return on Equity = Net Profit (from continuing operations) ÷ Shareholders' Equity
So, based on the above formula, the ROE for Appen is:
7.3% = US$29m ÷ US$392m (Based on the trailing twelve months to December 2021).
The 'return' is the profit over the last twelve months. So, this means that for every A$1 of its shareholder's investments, the company generates a profit of A$0.07.
What Is The Relationship Between ROE And Earnings Growth?
We have already established that ROE serves as an efficient profit-generating gauge for a company's future earnings. Based on how much of its profits the company chooses to reinvest or "retain", we are then able to evaluate a company's future ability to generate profits. Assuming all else is equal, companies that have both a higher return on equity and higher profit retention are usually the ones that have a higher growth rate when compared to companies that don't have the same features.
A Side By Side comparison of Appen's Earnings Growth And 7.3% ROE
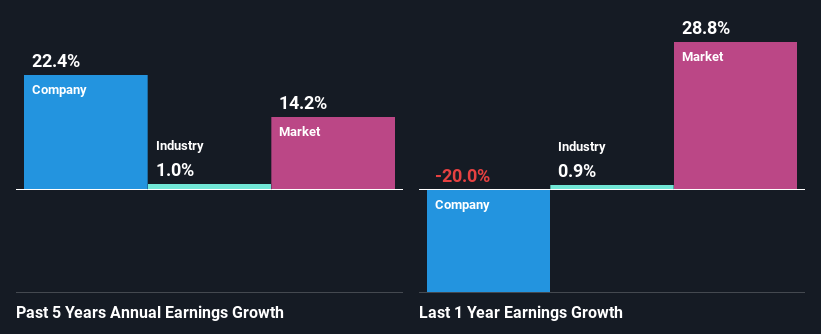
On the face of it, Appen's ROE is not much to talk about. Yet, a closer study shows that the company's ROE is similar to the industry average of 8.3%. Particularly, the exceptional 22% net income growth seen by Appen over the past five years is pretty remarkable. Taking into consideration that the ROE is not particularly high, we reckon that there could also be other factors at play which could be influencing the company's growth. For instance, the company has a low payout ratio or is being managed efficiently.
We then compared Appen's net income growth with the industry and we're pleased to see that the company's growth figure is higher when compared with the industry which has a growth rate of 1.0% in the same period.
The basis for attaching value to a company is, to a great extent, tied to its earnings growth. It’s important for an investor to know whether the market has priced in the company's expected earnings growth (or decline). This then helps them determine if the stock is placed for a bright or bleak future. Is Appen fairly valued compared to other companies? These 3 valuation measures might help you decide.
Is Appen Using Its Retained Earnings Effectively?
Appen has a really low three-year median payout ratio of 22%, meaning that it has the remaining 78% left over to reinvest into its business. This suggests that the management is reinvesting most of the profits to grow the business as evidenced by the growth seen by the company.
Moreover, Appen is determined to keep sharing its profits with shareholders which we infer from its long history of seven years of paying a dividend. Our latest analyst data shows that the future payout ratio of the company is expected to rise to 27% over the next three years. Still, forecasts suggest that Appen's future ROE will rise to 10% even though the the company's payout ratio is expected to rise. We presume that there could some other characteristics of the business that could be driving the anticipated growth in the company's ROE.
Conclusion
Overall, we feel that Appen certainly does have some positive factors to consider. Even in spite of the low rate of return, the company has posted impressive earnings growth as a result of reinvesting heavily into its business. Having said that, the company's earnings growth is expected to slow down, as forecasted in the current analyst estimates. To know more about the latest analysts predictions for the company, check out this visualization of analyst forecasts for the company.
Have feedback on this article? Concerned about the content? Get in touch with us directly. Alternatively, email editorial-team (at) simplywallst.com.
This article by Simply Wall St is general in nature. We provide commentary based on historical data and analyst forecasts only using an unbiased methodology and our articles are not intended to be financial advice. It does not constitute a recommendation to buy or sell any stock, and does not take account of your objectives, or your financial situation. We aim to bring you long-term focused analysis driven by fundamental data. Note that our analysis may not factor in the latest price-sensitive company announcements or qualitative material. Simply Wall St has no position in any stocks mentioned.
