
 Yahoo Finance
 Amcor (AMCR) Q3 Earnings Beat, Revenues Dip Y/Y on Low Volumes
Amcor Plc AMCR reported third-quarter fiscal 2024 (ended Mar 31, 2024) adjusted earnings per share (EPS) of approximately 18 cents, which beat the Zacks Consensus Estimate of 17 cents. This represents a 1.7% increase from the year-ago quarter, marking a return to growth after four consecutive quarters of decline. The growth is primarily attributed to the realization of benefits from structural cost initiatives.
Including special items, the company reported earnings per share (EPS) of 13 cents compared with 12 cents in the year-ago quarter.
Total revenues fell 7% year over year to $3.4 billion. The top line missed the Zacks Consensus Estimate of $3.53 billion.
Amcor PLC Price, Consensus and EPS Surprise
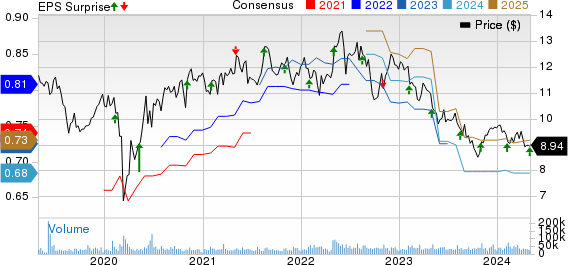
Amcor PLC price-consensus-eps-surprise-chart | Amcor PLC Quote
The price/mix had an unfavorable impact of around 3% on sales. Volume was down 4% from the year-ago quarter owing to weak demand in healthcare categories and the North America beverage business. Acquisitions contributed 1% to growth. A 1% favorable impact of movements in foreign exchange rates was offset by a 2% impact of pass-through of lower raw material costs.
Although volume growth remained negative, it was better than expected and improved from the 10% decline reported in the second quarter of fiscal 2024. Our model had forecasted a 5% volume decline and a favorable price/mix impact of 4.7% for the third quarter of fiscal 2024. Additionally, currency impact was anticipated to be positive at 1.7% while the pass-through of raw material costs was expected to have a negative impact of 0.3%.
Cost and Margins
The cost of sales was down 9% year over year to $2.7 billion. Gross profit rose 3% year over year to $692 million. The gross margin was 20.3% compared with the year-ago quarter’s 18.4%.
SG&A expenses were $330 million, reflecting an increase of 4% year over year. Adjusted operating income was $397 million, up 4% from $382 million in the year-ago quarter. Strong cost performance and benefits from restructuring initiatives helped offset the impact of lower volumes and unfavorable impacts from price/mix.
The adjusted operating margin was 11.6% compared with 10.4% in the year-ago quarter. Adjusted EBITDA in the quarter was $499 million compared with $484 million in the prior-year quarter.
Segment Performances
Flexibles: Net sales decreased 7% year over year to $2.6 billion. Volume was down 2% year over year due to destocking in healthcare categories and price/mix was an unfavorable 4%. Our model projected net sales of $2.68 billion based on an expectation of a year-over-year volume decline of 4.8% and a favorable price/mix of 4.3%.
The segment’s adjusted operating income moved up 6% year over year to $358 million reflecting gains from strong cost performance and restructuring actions. We expected an adjusted operating income of $348 million.
Rigid Packaging: The segment reported net sales of $813 million in the quarter, down 8% from the year-ago quarter. Volume was down 8% year over year reflecting lower beverage volumes amid weak demand in key categories. This was somewhat offset by a favorable price/mix impact of 1%. We had projected net sales at $876 million, which had factored in a year-over-year volume decline of 7.3% and a price/mix benefit of 5.7%.
Adjusted operating income was $71 million, up 3% year over year as favorable cost performance helped offset the impact of lower volumes. Our prediction for the segment’s operating income was $65 million.
Cash Flow & Balance Sheet Updates
As of the end of third-quarter fiscal 2024, Amcor had $457 million of cash and cash equivalents compared with $689 million as of fiscal 2023 end. The company generated $378 million of cash in operating activities in the first nine-month period of fiscal 2024 compared with $329 million in the year-ago comparable period.
As of Mar 31, 2024, Amcor’s net debt totaled $6.7 billion, up from $6.1 billion as of Jun 30, 2023.
Amcor returned $572 million to shareholders in the nine-month period ended Mar 31, 2024, through dividends and share repurchases. It has targeted total share repurchases of $70 million for fiscal 2024. Amcor’s board of directors had earlier raised its quarterly cash dividend to 12.5 cents per share from the previous payout of 12 cents per share.
FY24 Guidance
The company updated its adjusted EPS to 68.5-71 cents from its prior stated 67-71 cents for fiscal 2024. AMCR projects an adjusted free cash flow of $850-$950 million for fiscal 2024.
Price Performance
In the past year, Amcor’s shares have lost 19.2% compared with the industry’s 0.9% decline.
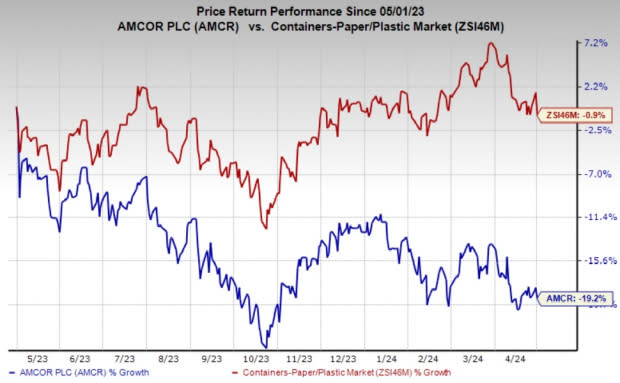
Image Source: Zacks Investment Research
Zacks Rank
Amcor currently carries a Zacks Rank #2 (Buy). You can see the complete list of today’s Zacks #1 Rank (Strong Buy) stocks here.
Performance of Other Packaging Stocks
AptarGroup, Inc. ATR reported first-quarter 2024 adjusted EPS of $1.26, beating the Zacks Consensus Estimate of $1.13. The bottom line increased 31% from 95 cents (including comparable exchange rates) per share in the year-ago quarter aided by strong sales growth in the Pharma business and continued margin expansion in the Beauty and Closures businesses.
AptarGroup’s total revenues increased 6.4% year over year to $915 million, surpassing the Zacks Consensus Estimate of $897 million. Core sales, excluding currency and acquisition effects, improved 5% year over year.
Sonoco Products Co. SON reported adjusted EPS of $1.12 in the first quarter of 2024, beating the Zacks Consensus Estimate of $1.08. The bottom line fell 20% from the prior-year quarter’s level as gains from improved productivity were offset by price/cost pressures and lower volumes.
Sonoco’s net sales were $1.64 billion, which fell short of the consensus estimate of $1.69 billion. The top line fell 5.3% year over year on lower volumes and pricing, somewhat offset by acquisitions.
Packaging Corporation of America PKG reported adjusted EPS of $1.72 in the first quarter of 2024, beating the Zacks Consensus Estimate of $1.63. The bottom line decreased 22% year over year mainly due to lower prices and mix in the Packaging and Paper segments. These were partially offset by higher volumes in the Packaging and Paper segments.
PKG’s sales in the quarter rose 0.2% year over year to $1.98 billion. The top line surpassed the Zacks Consensus Estimate of $1.91 billion.
Want the latest recommendations from Zacks Investment Research? Today, you can download 7 Best Stocks for the Next 30 Days. Click to get this free report
Sonoco Products Company (SON) : Free Stock Analysis Report
Packaging Corporation of America (PKG) : Free Stock Analysis Report
AptarGroup, Inc. (ATR) : Free Stock Analysis Report
Amcor PLC (AMCR) : Free Stock Analysis Report
