
 Yahoo Finance
 Ajinomoto (Malaysia) Berhad (KLSE:AJI) investors are sitting on a loss of 23% if they invested five years ago
Ajinomoto (Malaysia) Berhad (KLSE:AJI) shareholders should be happy to see the share price up 12% in the last quarter. But over the last half decade, the stock has not performed well. After all, the share price is down 31% in that time, significantly under-performing the market.
Now let's have a look at the company's fundamentals, and see if the long term shareholder return has matched the performance of the underlying business.
Check out our latest analysis for Ajinomoto (Malaysia) Berhad
To paraphrase Benjamin Graham: Over the short term the market is a voting machine, but over the long term it's a weighing machine. One way to examine how market sentiment has changed over time is to look at the interaction between a company's share price and its earnings per share (EPS).
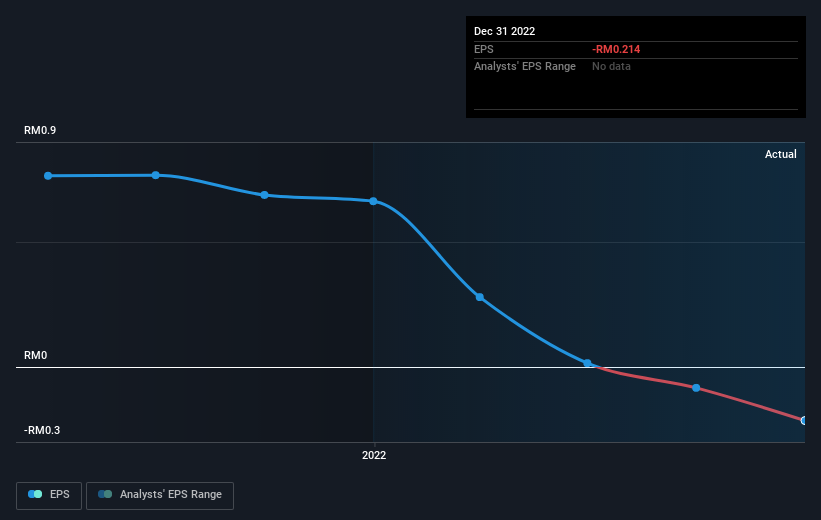
In the last half decade Ajinomoto (Malaysia) Berhad saw its share price fall as its EPS declined below zero. At present it's hard to make valid comparisons between EPS and the share price. But we would generally expect a lower price, given the situation.
You can see below how EPS has changed over time (discover the exact values by clicking on the image).
Dive deeper into Ajinomoto (Malaysia) Berhad's key metrics by checking this interactive graph of Ajinomoto (Malaysia) Berhad's earnings, revenue and cash flow.
What About Dividends?
It is important to consider the total shareholder return, as well as the share price return, for any given stock. The TSR incorporates the value of any spin-offs or discounted capital raisings, along with any dividends, based on the assumption that the dividends are reinvested. Arguably, the TSR gives a more comprehensive picture of the return generated by a stock. In the case of Ajinomoto (Malaysia) Berhad, it has a TSR of -23% for the last 5 years. That exceeds its share price return that we previously mentioned. And there's no prize for guessing that the dividend payments largely explain the divergence!
A Different Perspective
It's good to see that Ajinomoto (Malaysia) Berhad has rewarded shareholders with a total shareholder return of 10% in the last twelve months. Of course, that includes the dividend. That certainly beats the loss of about 4% per year over the last half decade. We generally put more weight on the long term performance over the short term, but the recent improvement could hint at a (positive) inflection point within the business. It's always interesting to track share price performance over the longer term. But to understand Ajinomoto (Malaysia) Berhad better, we need to consider many other factors. For instance, we've identified 1 warning sign for Ajinomoto (Malaysia) Berhad that you should be aware of.
If you like to buy stocks alongside management, then you might just love this free list of companies. (Hint: insiders have been buying them).
Please note, the market returns quoted in this article reflect the market weighted average returns of stocks that currently trade on Malaysian exchanges.
Have feedback on this article? Concerned about the content? Get in touch with us directly. Alternatively, email editorial-team (at) simplywallst.com.
This article by Simply Wall St is general in nature. We provide commentary based on historical data and analyst forecasts only using an unbiased methodology and our articles are not intended to be financial advice. It does not constitute a recommendation to buy or sell any stock, and does not take account of your objectives, or your financial situation. We aim to bring you long-term focused analysis driven by fundamental data. Note that our analysis may not factor in the latest price-sensitive company announcements or qualitative material. Simply Wall St has no position in any stocks mentioned.
Join A Paid User Research Session
You’ll receive a US$30 Amazon Gift card for 1 hour of your time while helping us build better investing tools for the individual investors like yourself. Sign up here
