
 Yahoo Finance
 Airline Stock Roundup: JBLU to Buy SAVE for $3.8 B, LUV's Q2 Earnings & More
In the past week, the bidding war for buying Spirit Airlines SAVE finally came to an end, with its deal with Frontier Group Holdings ULCC falling through. The other player in the race, JetBlue Airways JBLU, announced that it will merge with Spirit Airlines.
Southwest Airlines (LUV) reported better-than-expected earnings per share and revenues for second-quarter 2022. Results were aided by upbeat passenger revenues owing to buoyant air-travel demand. Meanwhile, Hawaiian Holdings HA reported a loss for second-quarter2022. However, the loss per share narrowed on a year-over-year basis. With the earnings season in full swing, June-quarter 2022 results of many airline companies were reported in detail in the previous week’s write up.
Recap of the Latest Top Stories
1. Southwest Airlines’ second-quarter 2022 earnings of $1.30 outpaced the Zacks Consensus Estimate of $1.17. Moreover, the bottom line improved more than 100% year over year. Operating revenues of $6,728 million outperformed the Zacks Consensus Estimate of $6,719.1 million and jumped 67.9% year over year. For third-quarter 2022, operating revenues are expected to register 8-12% growth from the third-quarter 2019 actuals. Economic fuel costs per gallon are expected to be $3.25-$3.35.LUV currently carries a Zacks Rank #3 (Hold).
You can see the complete list of today’s Zacks #1 Rank (Strong Buy) stocks here.
2. Hawaiian Holdings’ second-quarter 2022 loss (excluding 18 cents from non-recurring items) of 90 cents per share was wider than the Zacks Consensus Estimate of a loss of 86 cents. HA reported a loss of $1.44 in the year-ago quarter. Moreover, quarterly revenues of $691.9 million surged 68.4% year over year and beat the Zacks Consensus Estimate of $665.1 million.
Passenger revenues (contributing 89.2% to the top line) surged 73.3% year over year to $617.5 million. Scheduled airline traffic, measured in revenue passenger miles, rose 39.7% year over year to 3,862,507 million in the quarter under review. Scheduled capacity (measured in available seat miles) increased 27% to 4,505,285 million. Load factor (percentage of seats filled by passengers) improved 7.7 percentage points to 85.7% in the reported quarter as traffic surge outweighed capacity expansion. Passenger revenue per ASM (PRASM) soared 36.4% to 13.71 cents. Yield increased 24%.
Operating revenue per available seat mile (RASM: a key measure of unit revenues) in the quarter rose 33.8% year over year to 15.32 cents for total operations. Average fuel cost per gallon (economic) increased 109% to $3.95 in the second quarter. Gallons of jet fuel consumed increased 29.4% in the June quarter with more flights in operation.
As of Jun 30, 2022, Hawaiian Holdings’ unrestricted cash, cash equivalents and short-term investments totaled $1.5 billion. Outstanding debt and finance lease obligations were $1.8 billion.
For the third quarter of 2022, capacity (or ASMs) is projected to decline 5-8% from the third-quarter 2019 levels. Total revenues are anticipated to vary between a decline of 3.5% and a 0.5% increase from the third-quarter 2019 levels. Costs per ASM (excluding fuel & non-recurring items) are expected to rise 8-12% from the third-quarter 2019 numbers. Gallons of jet fuel consumed are expected to fall 7-10% from the third-quarter 2019 actuals. Adjusted EBITDA is expected between $15 and $75 million. Fuel price per gallon is expected to be $3.50.
For 2022, capacity is projected to decline 8-11% from the 2019 levels. Costs per ASM (excluding fuel & non-recurring items) are expected to rise 12-15% from the 2019 levels. Gallons of jet fuel consumed are expected to fall 11-14% from the 2019 actuals. Fuel price per gallon is expected to be $3.36 for the full year. Effective tax rate is expected to be 19.5%. Capital expenditure is expected between $105 million and $125 million.
3. Following the termination of the deal between Spirit Airlines and Frontier Airlines, JBLU agreed to buy SAVE for $3.8 billion. The deal on materialization will create the fifth largest airline in the United States. Per the terms of the deal, JBLU will pay $33.5 in cash for each share of SAVE. If the deal becomes effective after clearing regulatory hurdles, JBLU’s management confirmed that the carrier will buy more planes, boost the pilot-hiring process and renovate SAVE planes by adding to the legroom and boosting in-flight entertainment. The deal is expected to close by first-half 2024.
4. SkyWest SKYW reported second-quarter 2022 earnings of $1.07 per share, surpassing the Zacks Consensus Estimate of 48 cents. In the year-ago quarter, SKYW reported earnings of 1.22 per share. The 12.3% year-over-year decline in earnings was due to the 31% rise in total costs. Revenues of $799 million outperformed the Zacks Consensus Estimate of $699 million. The top line jumped 21.6% year over year, courtesy of a 3.3% increase in block hours (a measure of aircraft utilization) on completed flights. Addition of 43 planes to its fleet since second-quarter 2021 and COVID-related revenue concessions given to SkyWest’s major airline partners in the second quarter of 2021 led to year-over-year top-line growth.
Revenues from flying agreements (contributing 96.8% to the top line) rose 22.2% from the year-ago quarter’s figure. Expenses pertaining to salary, wages and benefits increased 23.6% in the quarter. With oil price rising, aircraft fuel expenses escalated 31.6% year over year. The airline carried 19.6% more passengers year over year. Passenger load factor (percentage of seats filled by passengers) increased 9.6 percentage points to 86% in the June quarter owing to the uptick in air-travel demand. SkyWest exited the second quarter with cash and marketable securities of $974.7 million compared with $860 million at the end of 2021. Long-term debt (net of current maturities) was $2.86 billion compared with $2.71 billion at December 2021 end. Capital expenditures during the June quarter were $197 million. The spending was due to the purchase of eight E175s and other fixed assets by SKYW during the quarter.
Performance
The following table shows the price movement of the major airline players over the past week and during the last six months.
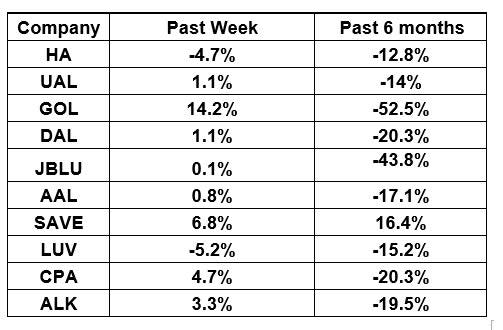
Image Source: Zacks Investment Research
The table above shows that most airline stocks have traded in the green over the past five trading days. The NYSE ARCA Airline Index has increased 4% to $59.58. Over the past six months, the NYSE ARCA Airline Index has plummeted 27.6%.
What's Next in the Airline Space?
Second-quarter earnings reports from many other carriers are scheduled in the coming days.
Want the latest recommendations from Zacks Investment Research? Today, you can download 7 Best Stocks for the Next 30 Days. Click to get this free report
Southwest Airlines Co. (LUV) : Free Stock Analysis Report
JetBlue Airways Corporation (JBLU) : Free Stock Analysis Report
Spirit Airlines, Inc. (SAVE) : Free Stock Analysis Report
Hawaiian Holdings, Inc. (HA) : Free Stock Analysis Report
SkyWest, Inc. (SKYW) : Free Stock Analysis Report
Frontier Group Holdings, Inc. (ULCC) : Free Stock Analysis Report
To read this article on Zacks.com click here.
Zacks Investment Research
