
 Yahoo Finance
 How Has Ainsworth Game Technology Limited’s (ASX:AGI) Performed Against The Industry?

After reading Ainsworth Game Technology Limited’s (ASX:AGI) most recent earnings announcement (31 December 2017), I found it useful to look back at how the company has performed in the past and compare this against the latest numbers. As a long term investor, I pay close attention to earnings trend, rather than the figures published at one point in time. I also compare against an industry benchmark to check whether Ainsworth Game Technology’s performance has been impacted by industry movements. In this article I briefly touch on my key findings.
Check out our latest analysis for Ainsworth Game Technology
Was AGI’s recent earnings decline worse than the long-term trend and the industry?
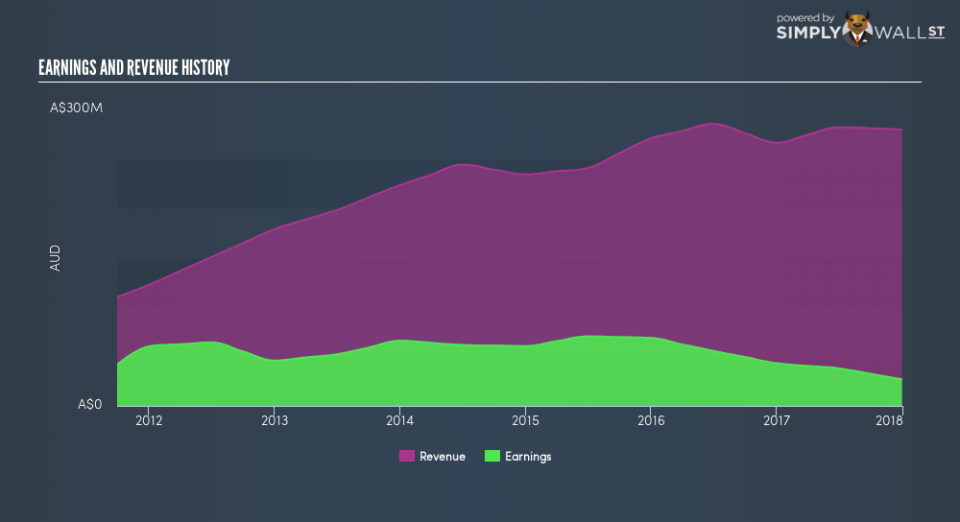
AGI’s trailing twelve-month earnings (from 31 December 2017) of AU$27.0m has declined by -37.5% compared to the previous year. Furthermore, this one-year growth rate has been lower than its average earnings growth rate over the past 5 years of -4.4%, indicating the rate at which AGI is growing has slowed down. Why could this be happening? Well, let’s look at what’s occurring with margins and if the whole industry is experiencing the hit as well.
Revenue growth over the past few years, has been positive, however earnings growth has been deteriorating. This means Ainsworth Game Technology has been increasing expenses, which is hurting margins and earnings, and is not a sustainable practice. Looking at growth from a sector-level, the Australian hospitality industry has been growing its average earnings by double-digit 15.0% over the past twelve months, and 19.7% over the last five years. This growth is a median of profitable companies of 15 Hospitality companies in AU including Crown Resorts, Star Entertainment Group and Eumundi Group. This suggests that whatever uplift the industry is benefiting from, Ainsworth Game Technology has not been able to reap as much as its average peer.
In terms of returns from investment, Ainsworth Game Technology has fallen short of achieving a 20% return on equity (ROE), recording 7.7% instead. Furthermore, its return on assets (ROA) of 5.3% is below the AU Hospitality industry of 7.4%, indicating Ainsworth Game Technology’s are utilized less efficiently. And finally, its return on capital (ROC), which also accounts for Ainsworth Game Technology’s debt level, has declined over the past 3 years from 31.5% to 8.6%. This correlates with an increase in debt holding, with debt-to-equity ratio rising from 0.8% to 19.4% over the past 5 years.
What does this mean?
While past data is useful, it doesn’t tell the whole story. Usually companies that face a prolonged period of decline in earnings are undergoing some sort of reinvestment phase with the aim of keeping up with the latest industry disruption and expansion. I recommend you continue to research Ainsworth Game Technology to get a more holistic view of the stock by looking at:
Future Outlook: What are well-informed industry analysts predicting for AGI’s future growth? Take a look at our free research report of analyst consensus for AGI’s outlook.
Financial Health: Are AGI’s operations financially sustainable? Balance sheets can be hard to analyze, which is why we’ve done it for you. Check out our financial health checks here.
Other High-Performing Stocks: Are there other stocks that provide better prospects with proven track records? Explore our free list of these great stocks here.
NB: Figures in this article are calculated using data from the trailing twelve months from 31 December 2017. This may not be consistent with full year annual report figures.
To help readers see past the short term volatility of the financial market, we aim to bring you a long-term focused research analysis purely driven by fundamental data. Note that our analysis does not factor in the latest price-sensitive company announcements.
The author is an independent contributor and at the time of publication had no position in the stocks mentioned. For errors that warrant correction please contact the editor at editorial-team@simplywallst.com.
