
 Yahoo Finance
 What Ails Macy's (M) and the Other Department Store Stocks?
The earnings focus this week is exclusively on the Retail sector as traditional brick-and-mortar retailers, including department stores, come out with their quarterly results. The earlier Walmart (WMT) earnings release and this morning’s October Retail Sales report reconfirm that the consumer spending backdrop remains favorable.
That is certainly positive news for the retailers. But it is hardly a new development, as strength in household spending has been helping sustain U.S. economic growth in recent quarters even as manufacturing and other trade-exposed parts of the economy have been struggling.
Not all retailers have been able to capitalize on this favorable consumer spending environment. The stock market performance of traditional retailers shows this divergence in stark terms.
You can see this in the chart below where we have shown the year-to-date performance of four traditional retailers – Walmart, Dollar General (DG), Home Depot (HD) and Macy’s (M). It is perhaps fair to see each of these companies as proxies for their respective space in the broader Retail landscape.

Of these four companies, Walmart has already reported strong results, while Home Depot and Macy’s are on deck to report results on Tuesday and Thursday this week, respectively.
As you can see in the chart above, three of the four stocks have been stellar performers this year, but Macy’s appears to be in a league of its own. Most of the other department store stocks are not that far off from Macy’s performance lately. So, what’s driving the Macy’s underperformance?
The issues plaguing Macy’s are longstanding and not new. These include the company’s struggles with adjusting to the changed retail landscape characterized by consumer dollars steadily shifting to the online medium. Macy’s and other department stores have made good progress in recent years through their so-called omni-channel offerings that integrates the brick-and-mortar infrastructure with the digital offering. For Macy’s, store pickups accounted for 7% of total online sales in Q4, reflecting consumers’ growing embrace of the company’s omni-channel capabilities.
The challenge for Macy’s and other department stores is to hold onto their revenues and margins as they bring their operations in-line with the changed ground realities. But transitions are never smooth, easy and cheap. It is the inherent difficulties of this transition that explains the performance challenge facing Macy’s and other department store companies.
Q3 estimates for Macy’s, which reports quarterly results before the market’s open on Thursday November 21st, have steadily come down. The company is expected to earn just a penny per share on $5.3billion in revenues, down -96% and -1.7% from the year-earlier period, respectively. The current one cent estimate is down from 2 cents a week back and 4 cents three months back.
Given Macy’s recent underperformance and these lowered estimates, the bar is likely fairly low for the company to surprise to the upside. The stock was down big in response to the last quarterly release on August 14th.
The major retailers releasing results this week include, besides Macy’s and Home Depot, Target (TGT), Nordstrom (JWN), Gap (GPS) and Kohl’s (KSS). In total, we have more than 125 companies reporting Q3 results this week, including 15 S&P 500 members.
S&P 500 Scorecard (as of Friday, November 15th, 2019)
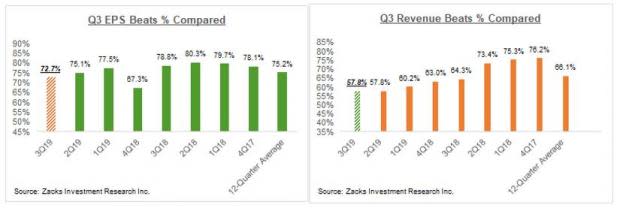
We now have Q3 results from 462 S&P 500 members or 92.4% of the index’s total membership. Total earnings (or aggregate net income) for these 462 companies are down -1.4% from the same period last year on +4.4% higher revenues, with 72.7% beating EPS estimates and 57.8% beating revenue estimates.
The comparison charts below put the Q3 earnings and revenue growth for these 462 index members in the context of what these same companies had reported in other recent periods.

The comparison charts below put the Q3 EPS and revenue beats percentages in historical context.
Looking at Q3 as a whole, combining the actual results from the 462 index members with estimates for the still-to-come companies, total earnings (or aggregate net income) is expected to be down -1.8% from the same period last year on +4.2% higher revenues.
The table provides a summary view of Q3 expectations contrasted with actual results for the preceding period.

Tough comparisons to last year when growth was boosted by the tax cut legislation were all along expected to weigh on earnings growth in 2019. Moderating U.S. economic growth and notable slowdowns in other major global economic regions are having a further negative impact. Uncertainty about the global trade regime and growing resort to tariffs are not helping matters either.
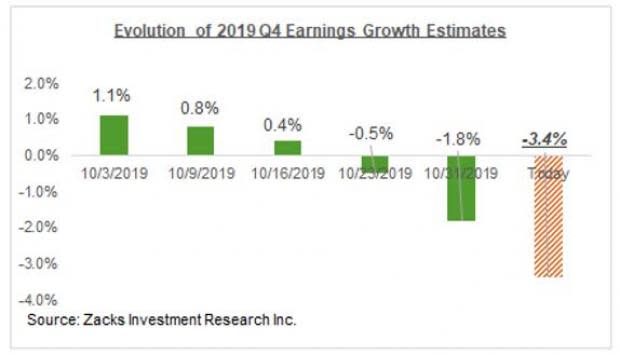
Estimates for the current period (2019 Q3) have come down since the quarter got underway, as the chart below shows.
The chart below shows the earnings and revenue growth picture for the S&P 500 index for Q3, contrasted with what was actually reported in the preceding 4 quarters and what is expected in the following 2 periods.

For an in-depth look at the overall earnings picture and expectations for Q3 and beyond, please check out our weekly Earnings Trends report >>> A Favorable Earnings Picture
Looking for Stocks with Skyrocketing Upside?
Zacks has just released a Special Report on the booming investment opportunities of legal marijuana.
Ignited by new referendums and legislation, this industry is expected to blast from an already robust $6.7 billion to $20.2 billion in 2021. Early investors stand to make a killing, but you have to be ready to act and know just where to look.
See the pot trades we're targeting>>
Want the latest recommendations from Zacks Investment Research? Today, you can download 7 Best Stocks for the Next 30 Days. Click to get this free report
Walmart Inc. (WMT) : Free Stock Analysis Report
Target Corporation (TGT) : Free Stock Analysis Report
Macy's, Inc. (M) : Free Stock Analysis Report
Kohl's Corporation (KSS) : Free Stock Analysis Report
Nordstrom, Inc. (JWN) : Free Stock Analysis Report
The Home Depot, Inc. (HD) : Free Stock Analysis Report
The Gap, Inc. (GPS) : Free Stock Analysis Report
Dollar General Corporation (DG) : Free Stock Analysis Report
To read this article on Zacks.com click here.
Zacks Investment Research
