
 Yahoo Finance
 Aeris Resources (ASX:AIS) Has Rewarded Shareholders With An Exceptional 460% Total Return On Their Investment
The most you can lose on any stock (assuming you don't use leverage) is 100% of your money. But on a lighter note, a good company can see its share price rise well over 100%. For example, the Aeris Resources Limited (ASX:AIS) share price has soared 200% in the last half decade. Most would be very happy with that. On top of that, the share price is up 93% in about a quarter. The company reported its financial results recently; you can catch up on the latest numbers by reading our company report.
View our latest analysis for Aeris Resources
To quote Buffett, 'Ships will sail around the world but the Flat Earth Society will flourish. There will continue to be wide discrepancies between price and value in the marketplace...' One flawed but reasonable way to assess how sentiment around a company has changed is to compare the earnings per share (EPS) with the share price.
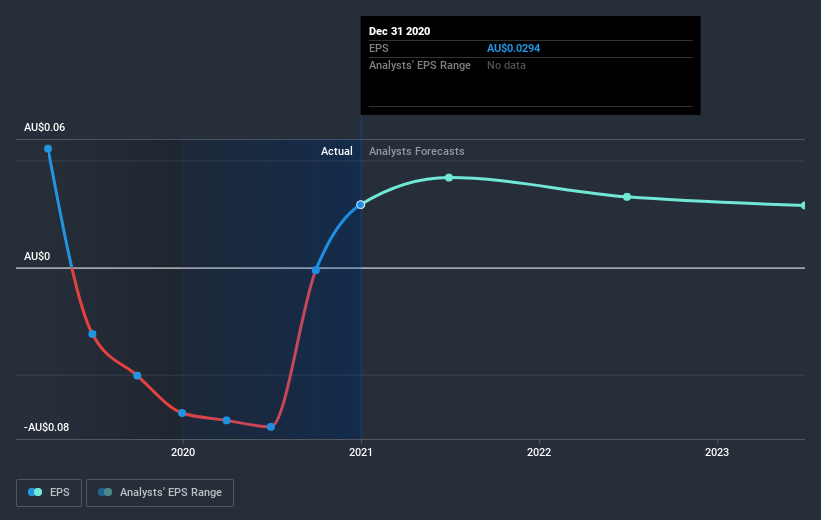
During the five years of share price growth, Aeris Resources moved from a loss to profitability. That kind of transition can be an inflection point that justifies a strong share price gain, just as we have seen here.
The graphic below depicts how EPS has changed over time (unveil the exact values by clicking on the image).
We know that Aeris Resources has improved its bottom line lately, but is it going to grow revenue? This free report showing analyst revenue forecasts should help you figure out if the EPS growth can be sustained.
What about the Total Shareholder Return (TSR)?
Investors should note that there's a difference between Aeris Resources' total shareholder return (TSR) and its share price change, which we've covered above. Arguably the TSR is a more complete return calculation because it accounts for the value of dividends (as if they were reinvested), along with the hypothetical value of any discounted capital that have been offered to shareholders. Aeris Resources' TSR of 460% for the 5 years exceeded its share price return, because it has paid dividends.
A Different Perspective
We're pleased to report that Aeris Resources shareholders have received a total shareholder return of 409% over one year. Since the one-year TSR is better than the five-year TSR (the latter coming in at 41% per year), it would seem that the stock's performance has improved in recent times. Someone with an optimistic perspective could view the recent improvement in TSR as indicating that the business itself is getting better with time. While it is well worth considering the different impacts that market conditions can have on the share price, there are other factors that are even more important. To that end, you should learn about the 3 warning signs we've spotted with Aeris Resources (including 1 which is a bit unpleasant) .
If you like to buy stocks alongside management, then you might just love this free list of companies. (Hint: insiders have been buying them).
Please note, the market returns quoted in this article reflect the market weighted average returns of stocks that currently trade on AU exchanges.
This article by Simply Wall St is general in nature. It does not constitute a recommendation to buy or sell any stock, and does not take account of your objectives, or your financial situation. We aim to bring you long-term focused analysis driven by fundamental data. Note that our analysis may not factor in the latest price-sensitive company announcements or qualitative material. Simply Wall St has no position in any stocks mentioned.
Have feedback on this article? Concerned about the content? Get in touch with us directly. Alternatively, email editorial-team (at) simplywallst.com.
