
 Yahoo Finance
 AECOM's (ACM) Earnings and Revenues Miss Estimates in Q1
AECOM ACM reported first-quarter fiscal 2020 results, with earnings and revenues missing the respective Zacks Consensus Estimate.
Delving Deeper
Adjusted earnings per share of 46 cents lagged the consensus mark of 67 cents by 31.3%. However, earnings increased 27.8% year over year. Moreover, revenues of $3,235.6 million missed the Zacks Consensus Estimate of $5,102 million by 36.6% and fell 3.6% year over year.
AECOM Price, Consensus and EPS Surprise
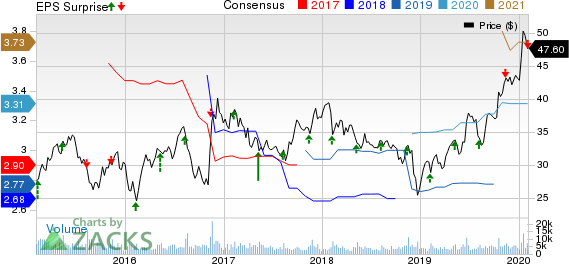
AECOM price-consensus-eps-surprise-chart | AECOM Quote
Segment Details
AECOM reports through three segments — Americas, which consists of the company’s business in the United States, Canada and Latin America; International, which consists of the company’s business in Europe, the Middle East, Africa and the Asia-Pacific regions; and AECOM Capital.
Notably, on Jan 31, 2020, the company sold its Management Services (MS) business.
Americas revenues were down 4.2% year over year to $2,452 million. This was primarily due to the expected reduction in disaster recovery activity in the U.S. Virgin Islands. On a constant-currency basis, organic revenues increased 2% year over year. Consistent underlying growth in the transportation, water and environment markets along with double-digit growth in Construction Management led to the upside. Adjusted operating income of $150.6 million grew 17.9% year over year. Moreover, adjusted operating margin expanded 220 basis points (bps) year over year, on solid execution, continued favorable end-market trends and strong backlog performance.
International revenues dropped 1.1% on a year-over-year basis to $783.1 million. On a constant-currency basis, organic revenues were flat year over year. Strong performance in the U.K. and Australia business was offset by expected weakness in Hong Kong. Adjusted operating income in the segment rose 80.7% year on year to $30 million. Adjusted operating margin expanded by a notable 210 bps year over year.
AECOM Capital (ACAP) — which develops real estate, public private partnership and infrastructure projects — contributed $0.5 million to total revenues. The segment recorded operating loss of $1.2 million.
Operating Highlights
AECOM’s gross margin expanded 140 bps from the prior-year quarter’s figure to 5.1%. Adjusted operating income in the quarter under review amounted to $143.8 million, up 31% from the year-ago quarter’s level. Adjusted EBITDA also increased 26.6% year over year to $173.4 million.
At the end of fiscal first quarter, the company’s total backlog was $36.5 billion, up 2% from prior-year quarter’s figure.
New order wins during fiscal first quarter were recorded at $3.3 billion. The company’s total book-to-burn ratio was 1.0, including solid performance across all the three segments.
Liquidity & Cash Flow
As of Dec 31, 2019, AECOM’s cash and cash equivalents totaled $725.4 million compared with $885.6 million at fiscal 2019-end.
As of Dec 31, 2019, total debt (excluding unamortized debt issuance cost) was $3.5 billion, increasing from $3.35 billion in the year-ago period. AECOM used $206.9 million cash from operating activities in fiscal first quarter versus $200.4 million in the year-ago quarter. It generated negative $238 million of free cash flow in the quarter compared with $222.3 million in the prior-year quarter.
Restructuring Update
AECOM is focused on its ongoing restructuring initiatives and expects to boost margin substantially, going forward.
It expects to incur restructuring expenses in the range of $160-$190 million, includes costs associated with recent executive transitions.
Total cash restructuring costs of $185-$205 million include capital expenditures associated with real estate restructuring of approximately $40 million.
Fiscal 2020 Guidance Reaffirmed
AECOM reaffirmed its fiscal 2020 guidance, with adjusted EBITDA in the range of $720-$760 million. It expects free cash flow within $100-$300 million.
The company expects to utilize the proceeds from the MS sale to reduce debt in the second quarter, including the immediate repayment of substantially all of its pre-payable debt. Also, it will repurchase stock while maintaining its long-term net leverage target of 2.0-2.5x.
Zacks Rank & Other Key Picks
AECOM currently carries a Zacks Rank #2 (Buy). You can see the complete list of today’s Zacks #1 Rank (Strong Buy) stocks here.
Few top-ranked stocks in the Zacks Construction Sector include M.D.C. Holdings, Inc. MDC, M/I Homes, Inc. MHO and D.R. Horton, Inc. DHI, each sporting a Zacks Rank #1.
M.D.C. Holdings 2020 earnings are expected to rise 14%.
M/I Homes has trailing four-quarter positive earnings surprise of 16.2%, on average. The company’s earnings beat estimates in all of the last four quarters.
D.R. Horton has three-five year expected earnings per share growth rate of 11.4%.
7 Best Stocks for the Next 30 Days
Just released: Experts distill 7 elite stocks from the current list of 220 Zacks Rank #1 Strong Buys. They deem these tickers “Most Likely for Early Price Pops.”
Since 1988, the full list has beaten the market more than 2X over with an average gain of +24.7% per year. So be sure to give these hand-picked 7 your immediate attention.
See 7 handpicked stocks now >>
Want the latest recommendations from Zacks Investment Research? Today, you can download 7 Best Stocks for the Next 30 Days. Click to get this free report
M/I Homes, Inc. (MHO) : Free Stock Analysis Report
D.R. Horton, Inc. (DHI) : Free Stock Analysis Report
M.D.C. Holdings, Inc. (MDC) : Free Stock Analysis Report
AECOM (ACM) : Free Stock Analysis Report
To read this article on Zacks.com click here.
Zacks Investment Research
