
 Yahoo Finance
 ABM Industries Incorporated (NYSE:ABM) Is Yielding 2.0% - But Is It A Buy?

Today we'll take a closer look at ABM Industries Incorporated (NYSE:ABM) from a dividend investor's perspective. Owning a strong business and reinvesting the dividends is widely seen as an attractive way of growing your wealth. Yet sometimes, investors buy a popular dividend stock because of its yield, and then lose money if the company's dividend doesn't live up to expectations.
While ABM Industries's 2.0% dividend yield is not the highest, we think its lengthy payment history is quite interesting. Before you buy any stock for its dividend however, you should always remember Warren Buffett's two rules: 1) Don't lose money, and 2) Remember rule #1. We'll run through some checks below to help with this.
Click the interactive chart for our full dividend analysis
Payout ratios
Dividends are usually paid out of company earnings. If a company is paying more than it earns, then the dividend might become unsustainable - hardly an ideal situation. Comparing dividend payments to a company's net profit after tax is a simple way of reality-checking whether a dividend is sustainable. Looking at the data, we can see that 54% of ABM Industries's profits were paid out as dividends in the last 12 months. This is a fairly normal payout ratio among most businesses. It allows a higher dividend to be paid to shareholders, but does limit the capital retained in the business - which could be good or bad.
Another important check we do is to see if the free cash flow generated is sufficient to pay the dividend. Of the free cash flow it generated last year, ABM Industries paid out 28% as dividends, suggesting the dividend is affordable. It's positive to see that ABM Industries's dividend is covered by both profits and cash flow, since this is generally a sign that the dividend is sustainable, and a lower payout ratio usually suggests a greater margin of safety before the dividend gets cut.
Is ABM Industries's Balance Sheet Risky?
As ABM Industries has a meaningful amount of debt, we need to check its balance sheet to see if the company might have debt risks. A quick check of its financial situation can be done with two ratios: net debt divided by EBITDA (earnings before interest, tax, depreciation and amortisation), and net interest cover. Net debt to EBITDA measures total debt load relative to company earnings (lower = less debt), while net interest cover measures the ability to pay interest on the debt (higher = greater ability to pay interest costs). With net debt of 2.83 times its EBITDA, ABM Industries has a noticeable amount of debt, although if business stays steady, this may not be overly concerning.
We calculated its interest cover by measuring its earnings before interest and tax (EBIT), and dividing this by the company's net interest expense. With EBIT of 3.85 times its interest expense, ABM Industries's interest cover is starting to look a bit thin.
Remember, you can always get a snapshot of ABM Industries's latest financial position, by checking our visualisation of its financial health.
Dividend Volatility
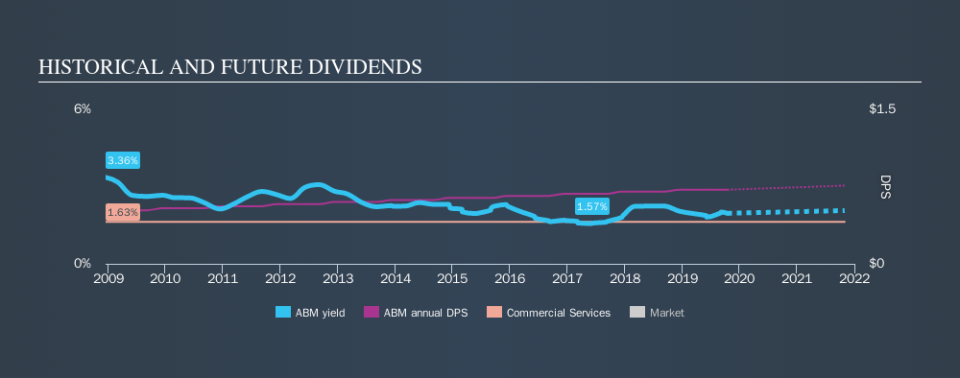
From the perspective of an income investor who wants to earn dividends for many years, there is not much point buying a stock if its dividend is regularly cut or is not reliable. For the purpose of this article, we only scrutinise the last decade of ABM Industries's dividend payments. During this period the dividend has been stable, which could imply the business could have relatively consistent earnings power. During the past ten-year period, the first annual payment was US$0.52 in 2009, compared to US$0.72 last year. This works out to be a compound annual growth rate (CAGR) of approximately 3.3% a year over that time.
Slow and steady dividend growth might not sound that exciting, but dividends have been stable for ten years, which we think is seriously impressive.
Dividend Growth Potential
Dividend payments have been consistent over the past few years, but we should always check if earnings per share (EPS) are growing, as this will help maintain the purchasing power of the dividend. ABM Industries has grown its earnings per share at 3.1% per annum over the past five years. 3.1% per annum is not a particularly high rate of growth, which we find curious. If the company is struggling to grow, perhaps that's why it elects to pay out more than half of its earnings to shareholders.
Conclusion
When we look at a dividend stock, we need to form a judgement on whether the dividend will grow, if the company is able to maintain it in a wide range of economic circumstances, and if the dividend payout is sustainable. First, we think ABM Industries has an acceptable payout ratio and its dividend is well covered by cashflow. Second, earnings growth has been mediocre, but at least the dividends have been relatively stable. ABM Industries has a number of positive attributes, but it falls slightly short of our (admittedly high) standards. Were there evidence of a strong moat or an attractive valuation, it could still be well worth a look.
Companies that are growing earnings tend to be the best dividend stocks over the long term. See what the 6 analysts we track are forecasting for ABM Industries for free with public analyst estimates for the company.
If you are a dividend investor, you might also want to look at our curated list of dividend stocks yielding above 3%.
We aim to bring you long-term focused research analysis driven by fundamental data. Note that our analysis may not factor in the latest price-sensitive company announcements or qualitative material.
If you spot an error that warrants correction, please contact the editor at editorial-team@simplywallst.com. This article by Simply Wall St is general in nature. It does not constitute a recommendation to buy or sell any stock, and does not take account of your objectives, or your financial situation. Simply Wall St has no position in the stocks mentioned. Thank you for reading.
