
 Yahoo Finance
 With A -47.25% Earnings Drop, Did Catalyst Metals Limited (ASX:CYL) Really Underperform?

When Catalyst Metals Limited (ASX:CYL) announced its most recent earnings (31 December 2017), I compared it against two factor: its historical earnings track record, and the performance of its industry peers on average. Being able to interpret how well Catalyst Metals has done so far requires weighing its performance against a benchmark, rather than looking at a standalone number at a point in time. In this article, I’ve summarized the key takeaways on how I see CYL has performed. See our latest analysis for Catalyst Metals
Did CYL perform worse than its track record and industry?
To account for any quarterly or half-yearly updates, I use data from the most recent 12 months, which annualizes the most recent half-year data, or in some cases, the latest annual report is already the most recent financial year data. This technique allows me to assess various companies on a similar basis, using the most relevant data points. For Catalyst Metals, its most recent earnings (trailing twelve month) is -AU$1.70M, which, in comparison to last year’s figure, has become more negative. Given that these figures may be relatively short-term thinking, I have calculated an annualized five-year figure for Catalyst Metals’s net income, which stands at -AU$1.38M. This doesn’t look much better, as earnings seem to have consistently been getting more and more negative over time.
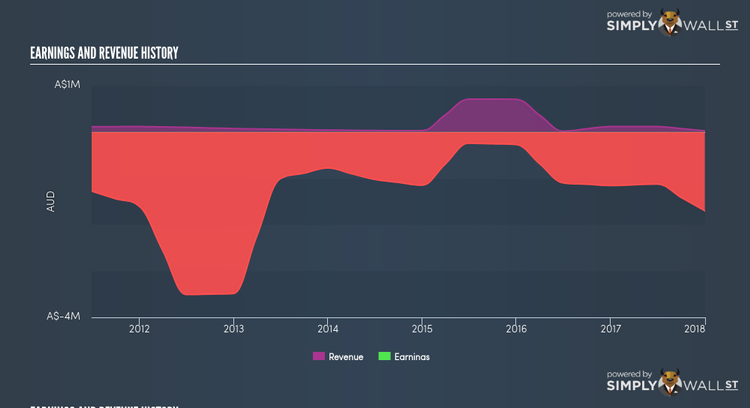
We can further evaluate Catalyst Metals’s loss by looking at what the industry has been experiencing over the past few years. Each year, for the past five years Catalyst Metals’s top-line has increased by 12.47% on average, implying that the company is in a high-growth period with expenses shooting ahead of revenues, leading to annual losses. Inspecting growth from a sector-level, the Australian metals and mining industry has been growing its average earnings by double-digit 18.18% over the prior year, and a more muted 8.68% over the previous five years. This suggests that any uplift the industry is benefiting from, Catalyst Metals has not been able to leverage it as much as its industry peers.
What does this mean?
Catalyst Metals’s track record can be a valuable insight into its earnings performance, but it certainly doesn’t tell the whole story. Companies that incur net loss is always difficult to predict what will occur going forward, and when. The most insightful step is to examine company-specific issues Catalyst Metals may be facing and whether management guidance has steadily been met in the past. You should continue to research Catalyst Metals to get a more holistic view of the stock by looking at:
Financial Health: Is CYL’s operations financially sustainable? Balance sheets can be hard to analyze, which is why we’ve done it for you. Check out our financial health checks here.
Other High-Performing Stocks: Are there other stocks that provide better prospects with proven track records? Explore our free list of these great stocks here.
NB: Figures in this article are calculated using data from the trailing twelve months from 31 December 2017. This may not be consistent with full year annual report figures.
To help readers see pass the short term volatility of the financial market, we aim to bring you a long-term focused research analysis purely driven by fundamental data. Note that our analysis does not factor in the latest price sensitive company announcements.
The author is an independent contributor and at the time of publication had no position in the stocks mentioned.
