
 Yahoo Finance
 The 23% return this week takes Estia Health's (ASX:EHE) shareholders three-year gains to 109%
It might seem bad, but the worst that can happen when you buy a stock (without leverage) is that its share price goes to zero. But when you pick a company that is really flourishing, you can make more than 100%. For example, the Estia Health Limited (ASX:EHE) share price has soared 101% in the last three years. How nice for those who held the stock! Also pleasing for shareholders was the 32% gain in the last three months.
Since it's been a strong week for Estia Health shareholders, let's have a look at trend of the longer term fundamentals.
See our latest analysis for Estia Health
While the efficient markets hypothesis continues to be taught by some, it has been proven that markets are over-reactive dynamic systems, and investors are not always rational. One imperfect but simple way to consider how the market perception of a company has shifted is to compare the change in the earnings per share (EPS) with the share price movement.
During three years of share price growth, Estia Health achieved compound earnings per share growth of 7.1% per year. This EPS growth is lower than the 26% average annual increase in the share price. This suggests that, as the business progressed over the last few years, it gained the confidence of market participants. It's not unusual to see the market 're-rate' a stock, after a few years of growth.
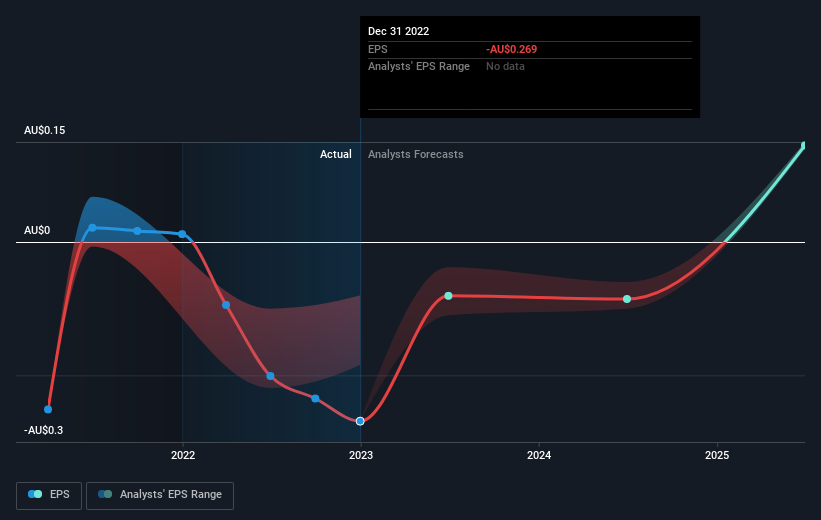
The company's earnings per share (over time) is depicted in the image below (click to see the exact numbers).
We consider it positive that insiders have made significant purchases in the last year. Having said that, most people consider earnings and revenue growth trends to be a more meaningful guide to the business. Dive deeper into the earnings by checking this interactive graph of Estia Health's earnings, revenue and cash flow.
What About Dividends?
It is important to consider the total shareholder return, as well as the share price return, for any given stock. Whereas the share price return only reflects the change in the share price, the TSR includes the value of dividends (assuming they were reinvested) and the benefit of any discounted capital raising or spin-off. Arguably, the TSR gives a more comprehensive picture of the return generated by a stock. We note that for Estia Health the TSR over the last 3 years was 109%, which is better than the share price return mentioned above. The dividends paid by the company have thusly boosted the total shareholder return.
A Different Perspective
We're pleased to report that Estia Health shareholders have received a total shareholder return of 20% over one year. And that does include the dividend. There's no doubt those recent returns are much better than the TSR loss of 1.6% per year over five years. The long term loss makes us cautious, but the short term TSR gain certainly hints at a brighter future. It is all well and good that insiders have been buying shares, but we suggest you check here to see what price insiders were buying at.
Estia Health is not the only stock that insiders are buying. For those who like to find winning investments this free list of growing companies with recent insider purchasing, could be just the ticket.
Please note, the market returns quoted in this article reflect the market weighted average returns of stocks that currently trade on Australian exchanges.
Have feedback on this article? Concerned about the content? Get in touch with us directly. Alternatively, email editorial-team (at) simplywallst.com.
This article by Simply Wall St is general in nature. We provide commentary based on historical data and analyst forecasts only using an unbiased methodology and our articles are not intended to be financial advice. It does not constitute a recommendation to buy or sell any stock, and does not take account of your objectives, or your financial situation. We aim to bring you long-term focused analysis driven by fundamental data. Note that our analysis may not factor in the latest price-sensitive company announcements or qualitative material. Simply Wall St has no position in any stocks mentioned.
Join A Paid User Research Session
You’ll receive a US$30 Amazon Gift card for 1 hour of your time while helping us build better investing tools for the individual investors like yourself. Sign up here
