Advertisement
Australia markets close in 5 hours 30 minutes
  • ALL ORDS

    7,889.00
    +28.00 (+0.36%)
     
  • ASX 200

    7,633.40
    +27.80 (+0.37%)
     
  • AUD/USD

    0.6440
    +0.0003 (+0.05%)
     
  • OIL

    82.71
    +0.02 (+0.02%)
     
  • GOLD

    2,384.00
    -4.40 (-0.18%)
     
  • Bitcoin AUD

    94,942.51
    -4,087.39 (-4.13%)
     
  • CMC Crypto 200

    885.54
    0.00 (0.00%)
     
  • AUD/EUR

    0.6035
    +0.0009 (+0.14%)
     
  • AUD/NZD

    1.0891
    +0.0017 (+0.16%)
     
  • NZX 50

    11,807.04
    -68.31 (-0.58%)
     
  • NASDAQ

    17,493.62
    -220.04 (-1.24%)
     
  • FTSE

    7,847.99
    +27.63 (+0.35%)
     
  • Dow Jones

    37,753.31
    -45.66 (-0.12%)
     
  • DAX

    17,770.02
    +3.79 (+0.02%)
     
  • Hang Seng

    16,251.84
    +2.87 (+0.02%)
     
  • NIKKEI 225

    37,714.13
    -247.67 (-0.65%)
     

Coca-Cola's COVID-19 Conundrum in 1 Handy Chart

Coca-Cola's COVID-19 Conundrum in 1 Handy Chart

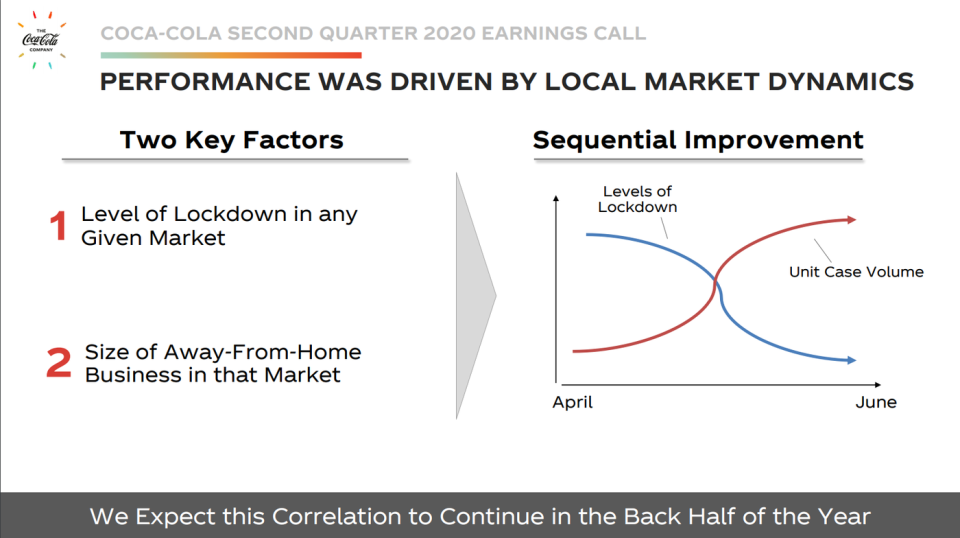
Coke's management offered a detailed plan for managing through the COVID-19 pandemic, supported by one simple but telling chart. Coca-Cola's case volume fell 16% year over year. The concepts on display here are simple enough: Heavy lockdowns hurt Coca-Cola's sales more, especially in markets where a lot of the company's sales are poured through soda fountains.