
 Yahoo Finance
 Using Trend Lines to Identify High Probability EURUSD Move
Talking Points-
Trend lines are a widely used trading tool in forex technical analysis
EUR to USD exchange rate is on top of a five year trend line increasing the chance of a big move coming
Try trading the EURUSD in a demo account
Trend lines are one of the oldest and most widely used tools in technical analysis. Trend lines indicate levels of supply and demand where a big move is likely to take place.
The recent EUR to USD strength has caused the exchange rate to move higher into a five year resistance trend line. Since a five year trend line will likely produce a more violent move than a five day trend line, the EUR/USD rate stands near an important level that many traders are expecting big moves to develop from.
(For more teaching on what trend lines are and how to draw them, watch this 35 minute recording on “Using Trend Lines to Time Entries.”)
Learn Forex: EUR/USD 5 Year Trend Line
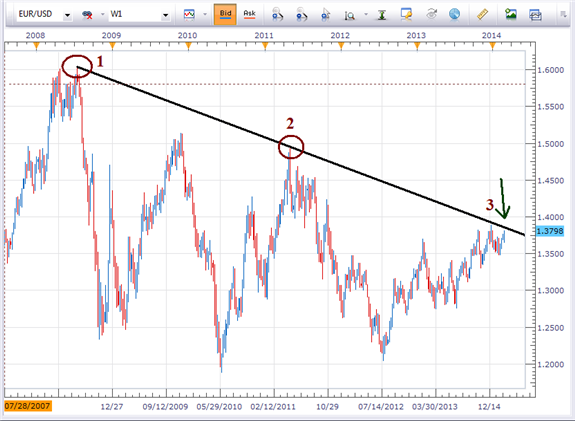
(Created using FXCM’s Marketscope charts)
As you can see from the chart above, if we draw a line connecting the July 2008 high (point 1) to the April 2011 high (point 2), we obtain a downward sloping trend resistance line.
Prices have been hovering near this resistance line since the last week of December 2013 (point 3). This line currently crosses near 1.3850 so expect price volatility to pick up.
Most traders are likely using this trend line as a level to initiate short positions. Don’t be surprised to see the pair spike higher to fool those line watchers into thinking the trend line is breaking in favor of higher prices. A daily close above the December 27, 2013 high of 1.3892 would be enough of a break to close out any short positions.
Since this is a 5 year trend line, whether it holds or breaks, there are likely some big moves in the EUR/USD on the horizon.
Try trading the EURUSD for yourself. Enroll for a free practice account, draw the tend line and place a trade based on this widely used trading tool.
---Written by Jeremy Wagner, Head Trading Instructor, DailyFX Education
Follow me on Google+ .
Follow me on Twitter at @JWagnerFXTrader. To be added to Jeremy’s e-mail distribution list, click HERE and select SUBSCRIBE then enter in your email information.
See Jeremy’s recent articles at his DailyFX Forex Educators Bio Page.
Trend lines are a great tool for timing entries. Most traders lose in their trading account because they over emphasize each trade and risk too much. Learn how to keep risk in check through this 20 minute on demand Money Management course.
Register for no charge with your name, email address, and phone numbers so you can start the course now!
DailyFX provides forex news and technical analysis on the trends that influence the global currency markets.
Learn forex trading with a free practice account and trading charts from FXCM.
