
 Yahoo Finance
 Investors in Chevron (NYSE:CVX) have seen favorable returns of 71% over the past three years
One simple way to benefit from the stock market is to buy an index fund. But if you pick the right individual stocks, you could make more than that. For example, the Chevron Corporation (NYSE:CVX) share price is up 51% in the last three years, clearly besting the market return of around 17% (not including dividends). On the other hand, the returns haven't been quite so good recently, with shareholders up just 7.8% , including dividends .
So let's investigate and see if the longer term performance of the company has been in line with the underlying business' progress.
See our latest analysis for Chevron
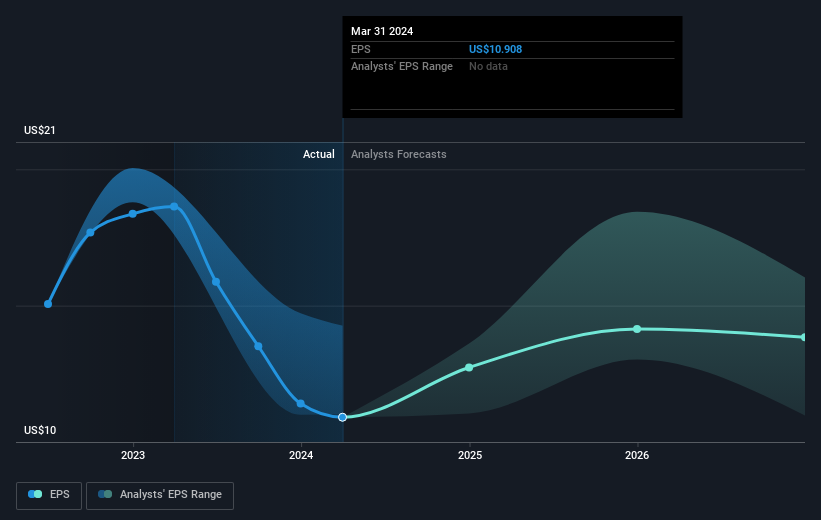
There is no denying that markets are sometimes efficient, but prices do not always reflect underlying business performance. One way to examine how market sentiment has changed over time is to look at the interaction between a company's share price and its earnings per share (EPS).
During three years of share price growth, Chevron moved from a loss to profitability. That would generally be considered a positive, so we'd expect the share price to be up.
The graphic below depicts how EPS has changed over time (unveil the exact values by clicking on the image).
We know that Chevron has improved its bottom line over the last three years, but what does the future have in store? It might be well worthwhile taking a look at our free report on how its financial position has changed over time.
What About Dividends?
As well as measuring the share price return, investors should also consider the total shareholder return (TSR). The TSR incorporates the value of any spin-offs or discounted capital raisings, along with any dividends, based on the assumption that the dividends are reinvested. So for companies that pay a generous dividend, the TSR is often a lot higher than the share price return. We note that for Chevron the TSR over the last 3 years was 71%, which is better than the share price return mentioned above. And there's no prize for guessing that the dividend payments largely explain the divergence!
A Different Perspective
Chevron shareholders are up 7.8% for the year (even including dividends). Unfortunately this falls short of the market return. It's probably a good sign that the company has an even better long term track record, having provided shareholders with an annual TSR of 11% over five years. Maybe the share price is just taking a breather while the business executes on its growth strategy. While it is well worth considering the different impacts that market conditions can have on the share price, there are other factors that are even more important. Consider for instance, the ever-present spectre of investment risk. We've identified 2 warning signs with Chevron , and understanding them should be part of your investment process.
If you would prefer to check out another company -- one with potentially superior financials -- then do not miss this free list of companies that have proven they can grow earnings.
Please note, the market returns quoted in this article reflect the market weighted average returns of stocks that currently trade on American exchanges.
Have feedback on this article? Concerned about the content? Get in touch with us directly. Alternatively, email editorial-team (at) simplywallst.com.
This article by Simply Wall St is general in nature. We provide commentary based on historical data and analyst forecasts only using an unbiased methodology and our articles are not intended to be financial advice. It does not constitute a recommendation to buy or sell any stock, and does not take account of your objectives, or your financial situation. We aim to bring you long-term focused analysis driven by fundamental data. Note that our analysis may not factor in the latest price-sensitive company announcements or qualitative material. Simply Wall St has no position in any stocks mentioned.
