
 Yahoo Finance
 GBP/USD Drops to New Yearly Lows on Dovish Bank of England
ASIA/EUROPE FOREX NEWS WRAP
One look at the GBPJPY and you’d be led to believe that all was well across the pond; after all, since mid-November, the pair had rallied over +2000-pips, and is up over +500-pips in the first six weeks of 2013 alone. While this seems like an impressive performance, it is entirely misleading: the British Pound is the second worst performing major currency this year, leading only the Japanese Yen – not exactly a feat of strength. Against its two highly traded counterparts, the Euro and the US Dollar, the Sterling has fallen by over -6.50% and -4.25%, respectively since the start of the year. News out of Britain today has done little to suggest the Sterling’s decline may be finished.
The Bank of England’s Quarterly Inflation Report was released today, and as has been the rumor for the past few days, the UK’s central bank did indeed downgrade its forecasts of the economy. Governor Mervyn King, whose term ends in July, went so far as to say that the BoE could “look through” elevated levels of inflation, as it becomes clearer that the fiscal drag present due to continued austerity from Chancellor of the Exchequer George Osborne will weigh on growth.
This is important for two reasons, both of which suggest further Sterling weakness ahead, despite the GBPUSD setting a fresh yearly low at 1.5533 today. First, it means that more quantitative easing could be on the way. Over the past several years, the combination of low interest rates and increased asset purchases has translated into lower yields on Gilts (British sovereign bonds), which dampens the appeal (return) on Pound-denominated assets. Second, it means that inflation is likely to run higher, further siphoning purchasing power from the British consumer – one who is already hamstrung by higher taxes and a weak, albeit slightly improving, labor market. Fittingly, the forecast for the Sterling calls for dark clouds ahead.
Taking a look at European credit, peripheral yields have dipped lower this morning, giving the Euro breathing room to trade higher across the board. The Italian 2-year note yield has held at 1.625% while the Spanish 2-year note yield has decreased to 2.574% (-7.4-bps). Similarly, the Italian 10-year note yield has decreased to 4.443% (-5.4-bps) while the Spanish 10-year note yield has decreased to 5.227% (-7.0-bps); lower yields imply higher prices.
RELATIVE PERFORMANCE (versus USD): 11:30 GMT
EUR: +0.25%
AUD: +0.24%
NZD: +0.07%
CHF:-0.10%
CAD:-0.14%
JPY:-0.18%
GBP:-0.66%
Dow Jones FXCM Dollar Index (Ticker: USDOLLAR): +0.22% (+0.18 % past 5-days)
ECONOMIC CALENDAR

See the DailyFX Economic Calendar for a full list, timetable, and consensus forecasts for upcoming economic indicators.
TECHNICAL ANALYSIS OUTLOOK
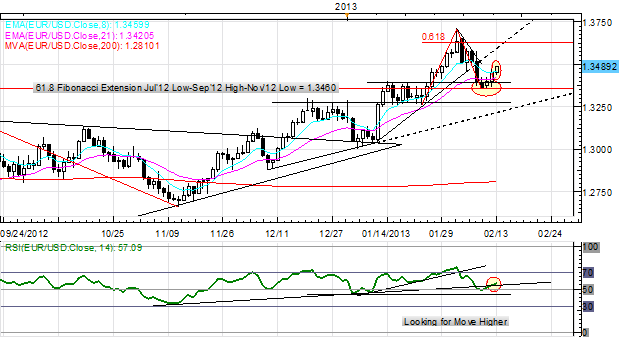
EURUSD: Price has rebounded towards 1.3500, but the view remains the same: “Price has steadied below 1.3400, entering the Bull Flag range set in mid-January, from 1.3280 to 1.3390. On lower-term timeframes, a Bear Flag may have formed, with the measured move pointing to 1.3280/300. A break lower can’t be ruled out, but as long as the ascending trendline off of the mid-December and early-January lows holds at 1.3215/35, any setbacks are seen as near-term corrections.”
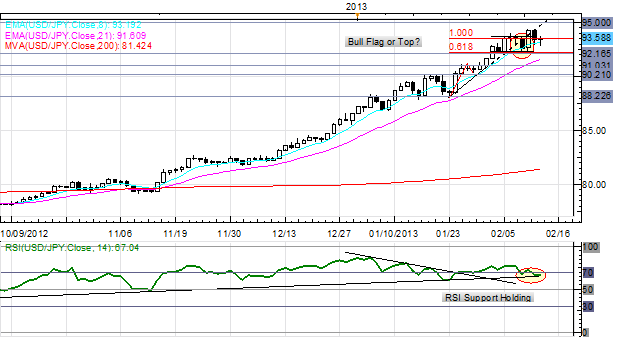
USDJPY: No change: “Further bullish price action as US Treasury yields strengthen and speculation over BoJ policy arises again.” Resistance comes in at 93.40/45 (monthly R1), 93.85 (weekly R1) and 94.00/10. Support comes in at 92.90/95 (weekly pivot), and 91.75/95 (weekly S1).
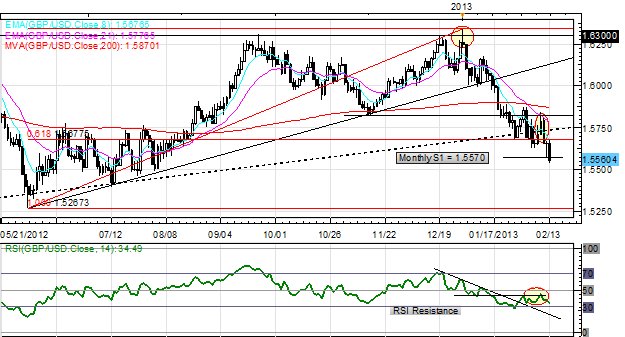
GBPUSD: The pair has broken to fresh yearly lows at 1.5533, and despite the daily Hammer yesterday, it held below the 61.8% Fibonacci retracement from the June low to January high, vindicating the “cover on dips, sell rallies” perspective. We continue to look to sell rallies in the pair as significant RSI divergence exists. A hold below 1.5560 eyes a move towards 1.5500, and ultimately, 1.5265/70, the June low. Resistance comes in at 1.5675 and 1.5825. Support is 1.5570/80 (monthly S1) and 1.5380.

AUDUSD:Yesterday I said: “The bounce from the 1.0265/90 area may have completed, with the rally halted at the 200-DMA at 1.0305/10. The pair is sitting at the 100% extension at 1.0265 now, and a break implies a deeper setback towards 1.0135/75, early-September and –October swing lows, as well as the 161.8% extension.” Although there was an overshoot into 1.0360, former support, failure has occurred, signaling further downside is possible. I’m still looking for a move into 1.0135/75.

S&P 500: Tuesday I said: “as indicated on the charts the past weeks, noting “nearing the top 1505/1512” – the top was 1504.6. If this breaks, 1520 is in sight.” Indeed, the irrational exuberance has continued, bringing topline Bearish Rising Wedge resistance in focus at 1520; the December 2007 highs of 1520/24 could be reached on an overshoot. The 100% Fibonacci extension on the fiscal cliff rally and flag comes in at 1530. Bottom line: I’m expecting a significant setback (-10%) in the S&P 500 unless volumes accelerate rapidly, given the disconnect from reality.

GOLD: The past few weeks I’ve maintained: "When considering the move off of the September highs, a measured A-B=C-D (as expressed on the Daily) suggests that a bottom could be in place at [1630/40].” A daily close above 1700 points towards 1722/25 and 1755. Support is 1640/45 and 1625/35.
--- Written by Christopher Vecchio, Currency Analyst
To contact Christopher Vecchio, e-mail cvecchio@dailyfx.com
Follow him on Twitter at @CVecchioFX
To be added to Christopher’s e-mail distribution list, please fill out this form
DailyFX provides forex news and technical analysis on the trends that influence the global currency markets.
Learn forex trading with a free practice account and trading charts from FXCM.
