
 Yahoo Finance
 Forex: USD/JPY Technical Analysis – Support Below 102.00 Tested
To receive Ilya's analysis directly via email, please SIGN UP HERE
Talking Points:
USD/JPY Technical Strategy: Flat
Support: 101.59 (23.6% Fib exp.), 100.90 (38.2% Fib ret.)
Resistance: 102.96 (Feb 11 high)
The Japanese Yen is continues to rise against the US Dollar after producing a Hanging Man candlestick. Prices are testing support at 101.59, the 23.6% Fibonacci expansion, with a break below this boundary exposing the 38.2% level at 100.90. Near-term resistance is at 102.69, the February 11 high.
A short position at current levels looks unattractive from a risk/reward perspective as prices trade squarely at immediate support. On the other hand, a long trade is premature absent confirmation of reversal. Indeed, the presence of support by no means guarantees that it will necessarily hold. We will remain on the sidelines for now.
Confirm your chart-based trade setups with the Technical Analyzer. New to FX? Start Here!
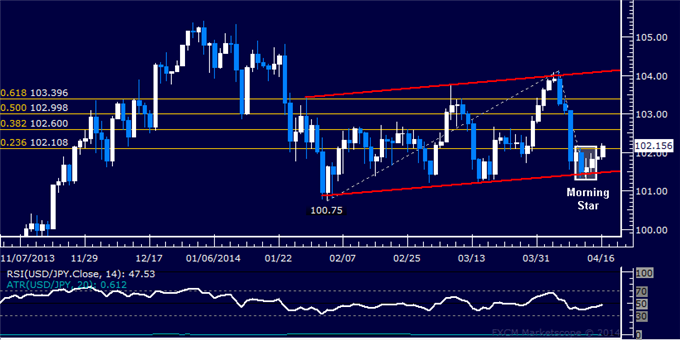
Daily Chart - Created Using FXCM Marketscope 2.0
--- Written by Ilya Spivak, Currency Strategist for DailyFX.com
DailyFX provides forex news and technical analysis on the trends that influence the global currency markets.
Learn forex trading with a free practice account and trading charts from FXCM.
