
 Yahoo Finance
 Archer-Daniels Midland Co's Dividend Analysis
Exploring the Sustainability and Growth of ADM's Dividend Payments
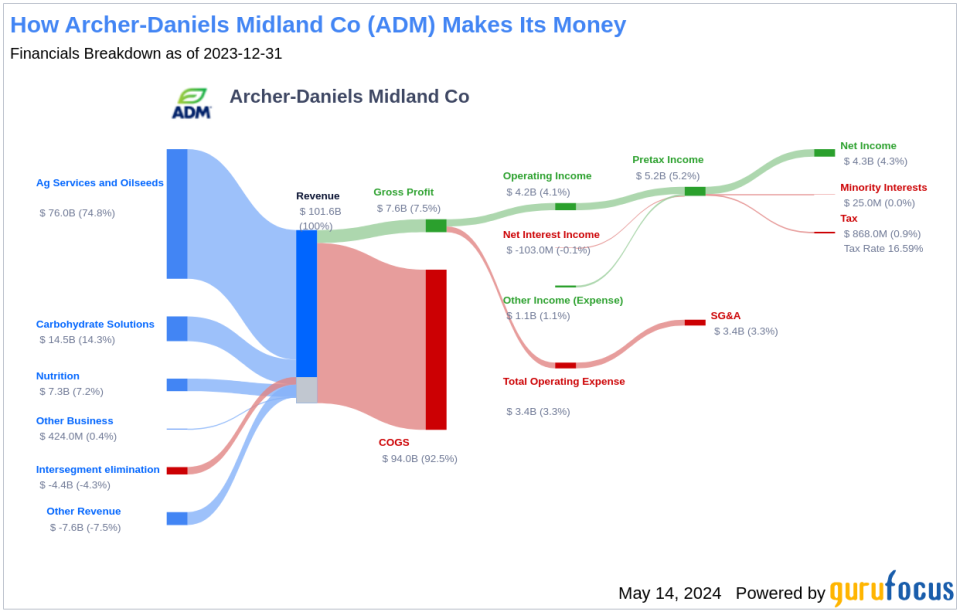
Archer-Daniels Midland Co (NYSE:ADM) recently announced a dividend of $0.5 per share, payable on 2024-06-05, with the ex-dividend date set for 2024-05-15. As investors look forward to this upcoming payment, the spotlight also shines on the company's dividend history, yield, and growth rates. Using the data from GuruFocus, let's look into Archer-Daniels Midland Co's dividend performance and assess its sustainability.
What Does Archer-Daniels Midland Co Do?
This Powerful Chart Made Peter Lynch 29% A Year For 13 Years
How to calculate the intrinsic value of a stock?
Archer-Daniels Midland is a major processor of oilseeds, corn, wheat, and other agricultural commodities. The company is also one of the largest grain merchandisers through its extensive network of logistical assets to store and transport crops around the globe. ADM also runs a nutrition business that focuses on both human and animal ingredients and is a large producer of corn-based sweeteners, starches, and ethanol.
A Glimpse at Archer-Daniels Midland Co's Dividend History
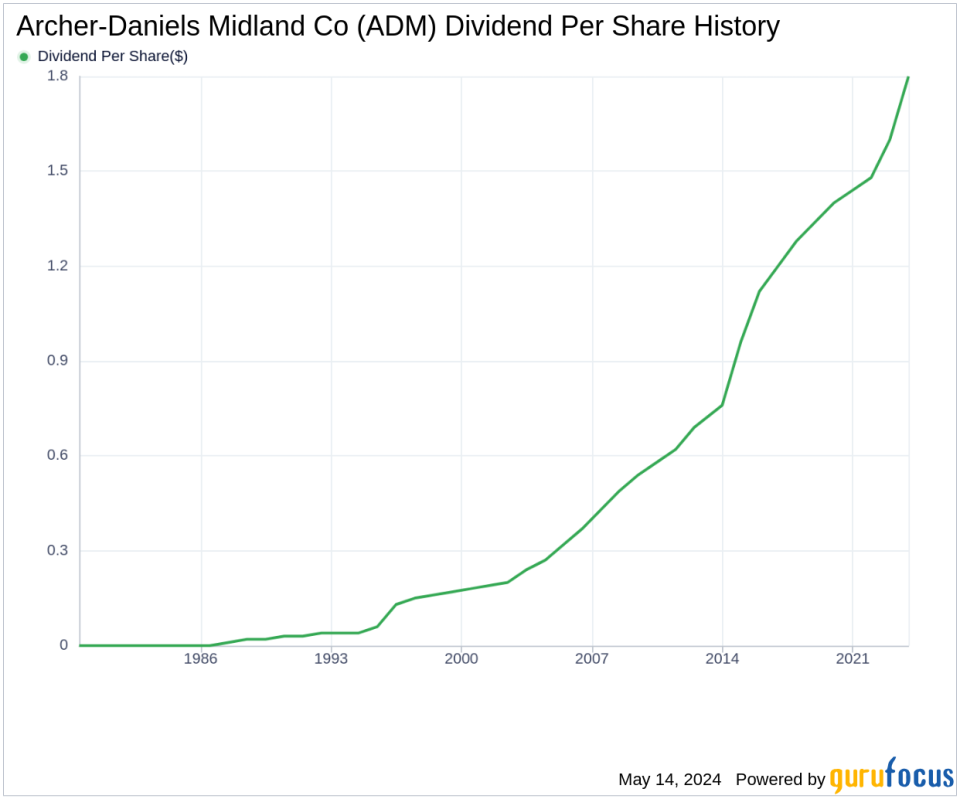
Archer-Daniels Midland Co has maintained a consistent dividend payment record since 1976. Dividends are currently distributed on a quarterly basis. Archer-Daniels Midland Co has increased its dividend each year since 1976. The stock is thus listed as a dividend aristocrat, an honor that is given to companies that have increased their dividend each year for at least the past 48 years.
Below is a chart showing annual Dividends Per Share for tracking historical trends.
Breaking Down Archer-Daniels Midland Co's Dividend Yield and Growth
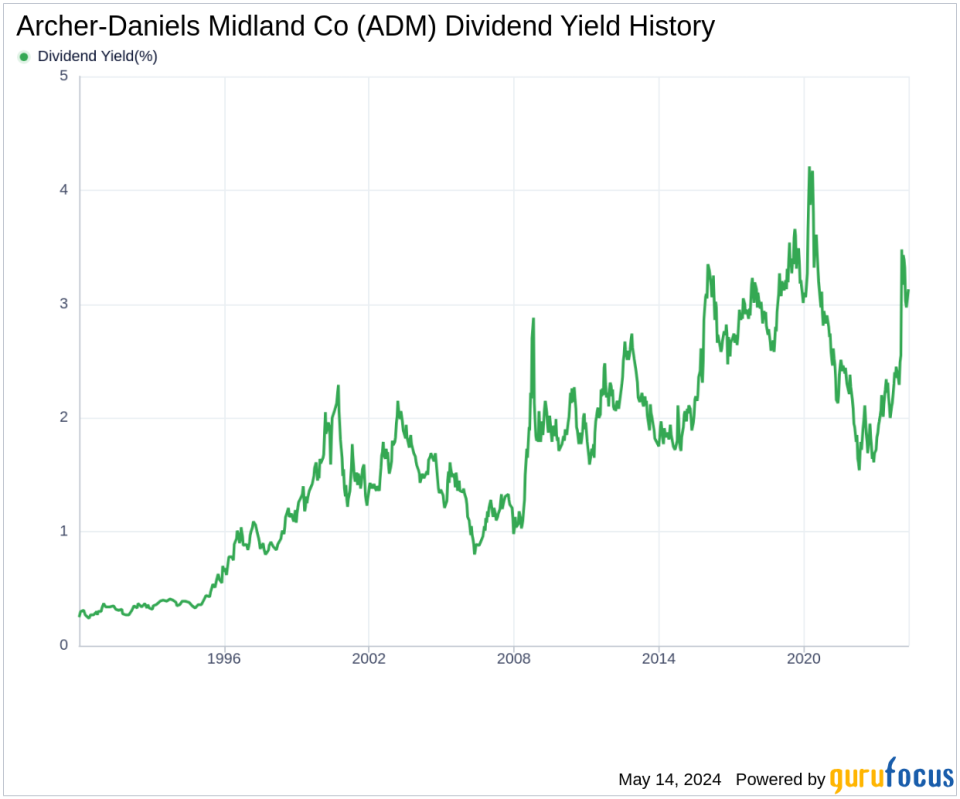
As of today, Archer-Daniels Midland Co currently has a 12-month trailing dividend yield of 2.95% and a 12-month forward dividend yield of 3.19%. This suggests an expectation of increased dividend payments over the next 12 months.
Over the past three years, Archer-Daniels Midland Co's annual dividend growth rate was 7.70%. Extended to a five-year horizon, this rate decreased to 5.60% per year. And over the past decade, Archer-Daniels Midland Co's annual dividends per share growth rate stands at 7.20%.
Based on Archer-Daniels Midland Co's dividend yield and five-year growth rate, the 5-year yield on cost of Archer-Daniels Midland Co stock as of today is approximately 3.87%.
The Sustainability Question: Payout Ratio and Profitability
To assess the sustainability of the dividend, one needs to evaluate the company's payout ratio. The dividend payout ratio provides insights into the portion of earnings the company distributes as dividends. A lower ratio suggests that the company retains a significant part of its earnings, thereby ensuring the availability of funds for future growth and unexpected downturns. As of 2024-03-31, Archer-Daniels Midland Co's dividend payout ratio is 0.29.
Archer-Daniels Midland Co's profitability rank, offers an understanding of the company's earnings prowess relative to its peers. GuruFocus ranks Archer-Daniels Midland Co's profitability 7 out of 10 as of 2024-03-31, suggesting good profitability prospects. The company has reported positive net income for each year over the past decade, further solidifying its high profitability.
Growth Metrics: The Future Outlook
To ensure the sustainability of dividends, a company must have robust growth metrics. Archer-Daniels Midland Co's growth rank of 7 out of 10 suggests that the company's growth trajectory is good relative to its competitors.
Revenue is the lifeblood of any company, and Archer-Daniels Midland Co's revenue per share, combined with the 3-year revenue growth rate, indicates a strong revenue model. Archer-Daniels Midland Co's revenue has increased by approximately 15.00% per year on average, a rate that outperforms approximately 73.36% of global competitors.
The company's 3-year EPS growth rate showcases its capability to grow its earnings, a critical component for sustaining dividends in the long run. During the past three years, Archer-Daniels Midland Co's earnings increased by approximately 24.80% per year on average, a rate that outperforms approximately 69.95% of global competitors.
Lastly, the company's 5-year EBITDA growth rate of 20.30%, which outperforms approximately 75.63% of global competitors.
Next Steps
Given Archer-Daniels Midland Co's robust dividend history, favorable growth metrics, and strong financial health, the company stands as a compelling candidate for investors seeking stable dividend income with growth potential. Investors should consider the company's consistent increase in dividends, supported by a solid payout ratio and profitability, as key indicators of its ability to maintain or potentially increase dividend distributions in the future.
GuruFocus Premium users can screen for high-dividend yield stocks using the High Dividend Yield Screener.
This article, generated by GuruFocus, is designed to provide general insights and is not tailored financial advice. Our commentary is rooted in historical data and analyst projections, utilizing an impartial methodology, and is not intended to serve as specific investment guidance. It does not formulate a recommendation to purchase or divest any stock and does not consider individual investment objectives or financial circumstances. Our objective is to deliver long-term, fundamental data-driven analysis. Be aware that our analysis might not incorporate the most recent, price-sensitive company announcements or qualitative information. GuruFocus holds no position in the stocks mentioned herein.
This article first appeared on GuruFocus.
